“…That’s sparked a swift jump in a Barclays Plc measure of the market’s ‘irrational exuberance’ — a phrase coined by former Federal Reserve Chair Alan Greenspan for when prices exceed assets’ fundamental values. The one-month average on the proprietary gauge has swung back into the double-digits for the first time since February — reaching levels that have signaled extreme frothiness in the past.”
--Bloomberg, July 2, 2025
“Wall Street ‘euphoria’ sparks bubble warnings.”
“Analysts point to signs of market froth as bitcoin soars and ‘meme stocks’ re-emerge.”
--Financial Times headline, July 25, 2025
My analysis of stock market revolves around two major factors: The sentiment backdrop to identify extremes in investors’ emotions that might set the stage for short- and longer-term turning points, and the technical backdrop with a focus on the trend and important levels that could trigger sentiment insights and foretell major moves.
The Barclays euphoria meter, which has drawn a lot of attention, piqued my interest for obvious reasons. As such, I used Google’s AI overview and found the drivers that have sent the model into euphoric levels:
“The EEI's recent spike is attributed to factors like the rally in Bitcoin, meme stocks, and speculative sectors like quantum computing and SPAC listings. Barclays suggests that while optimism is driven by potential trade deals and Fed rate cuts, fundamentals may be taking a backseat to speculative narratives.”
-Google AI overview, July 25, 2025
Certainly, these are factors that we can look back to months from now, if this model correctly nails what many view as an impending short-term and/or longer-term top.
If asked to challenge the assessment that market participants are in a state of euphoria, I would list several factors for my rebuttal.
- Bitcoin (BTC—119,454.80) is a separate asset than the U.S. stock market. Euphoria in a currency does not necessarily suggest euphoria in the stock market. There may be risk in BTC imploding, but price action alone isn’t a sentiment measure.
- The meme craze suggests that the retail crowd has taken on a speculative fever, but has been contained to a certain group of stocks that hardly dictate the overall direction of the broader S&P 500 Index (SPX—6,388.64). This might suggest risk among meme names that doesn’t necessarily translate into broad market risk.
- Other factors in the model, per Google AI, include investor surveys, forward price-to-earnings (P/E) ratio, and Cboe Market Volatility Index (VIX—14.93) levels. The VIX looks low on a chart, which could be contributing to the high euphoria reading. But with respect to the SPX's 21-day historical volatility (HV) of 6.7, a VIX reading around the 15 area might be considered high.
Also, consider the trio of investor surveys:
- The American Association of Individual Investors (AAII) reading shows 37% bullish, down from 45% bullish at the start of this month.
- The National Association of Active Investment Managers (NAAIM) reading of 81 last week (100 = fully invested; 200= leveraged long) is retreating from a July 2 reading of 99.
- The Investors Intelligence (II) survey showed 52% bullish (highs during the past seven years tend to run between 60-65% bulls) and 22% bearish (with 15% bears preceding troubles for the market since 2024 -- a percentage last reached in March 2024 and ahead of the second-quarter 2024 correction).
There are other tools for analyzing sentiment, a couple of which are far from indicating the “euphoric” market that has been touted. For example:
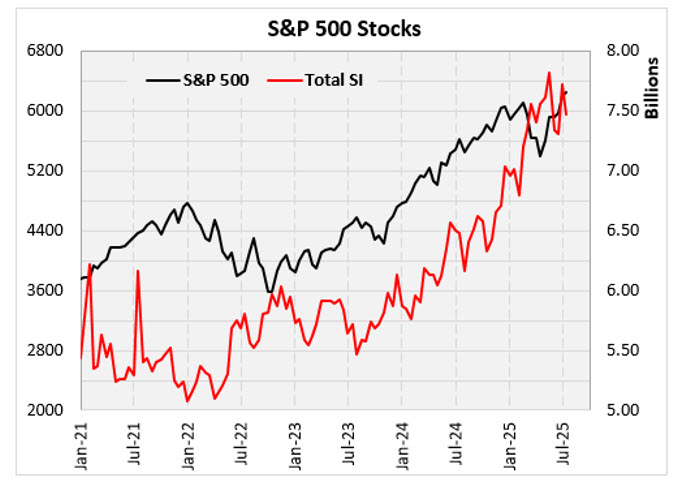
SPX Component Short Interest
Last seen 50% above the January 2022 trough, even after a mild tumble in the July 15 report. Moreover, 71% of SPX component stocks have short interest levels that are at least 25% above their respective 52-week short interest low.

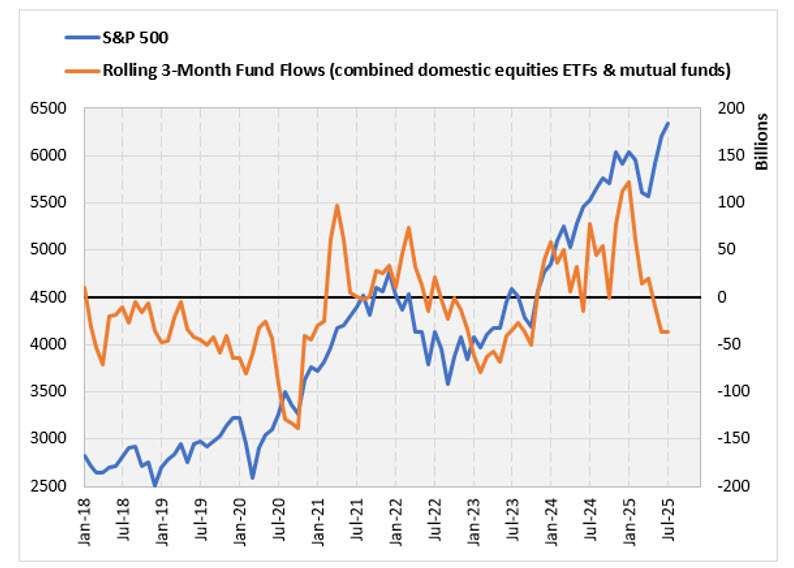
Domestic Equity Mutual Fund & Exchange-Traded Fund Flows
There have been net outflows from domestic equity funds, per the three-month rolling chart below. Using this tool, there was evidence of euphoria in late 2024 and early this year, ahead of the February-April pullback. It is hard to make the euphoria case now, though, as investors turn to overseas investment and commodities.

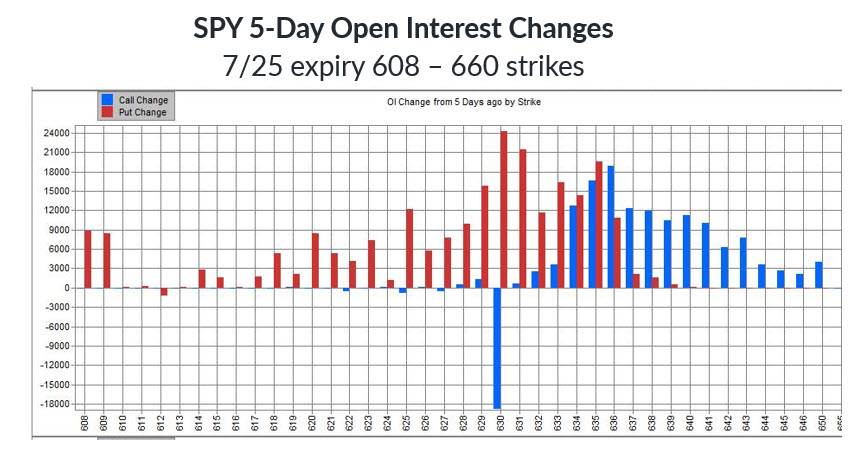
Option Activity on Nearest-Term Friday SPDR S&P 500 ETF Trust (SPY—637.10) Options
Five-day open interest changes on the nearest Friday weekly 7/25 SPY options do not show a call bias indicative of euphoria. In fact, the biggest open interest changes were put additions at the 630-strike, which expired worthless, and call liquidations at that same strike price. Short-term traders do not have a euphoric mentality.

A case can be made that euphoria might be present in certain sectors or assets, but this does not appear to be the case when assessing sentiment with respect to the broader stock market. It remains to be seen if the speculative excess in meme and quantum names spills into the broader market.
With the SPX making new all-time highs, there is evidence that sideline money and/or short covering could further support the broader indices. Plus, to the degree there is pockets of optimism, it is warranted until there is evidence of technical damage in the market.
“There is little in the way of obvious technical levels overhead on the SPX… levels worth watching that could induce profit-taking among those anchoring to key levels include:
- 6,469, which is 10% above the 2024 close
- 6,758, which is 10% above the February closing high
- The 6,958 – 7,000 area - the former representing a 161.8% Fibonacci extension of the February high and April low and the 7,000 level a round millennium number that is roughly double the major low in October 2022”
-Monday Morning Outlook, July 7, 2025
The SPX’s momentum favors the bulls ahead of a rate decision by the Federal Open Market Committee (FOMC) on Wednesday, and as we move into the height of earnings season for the next two to three weeks.
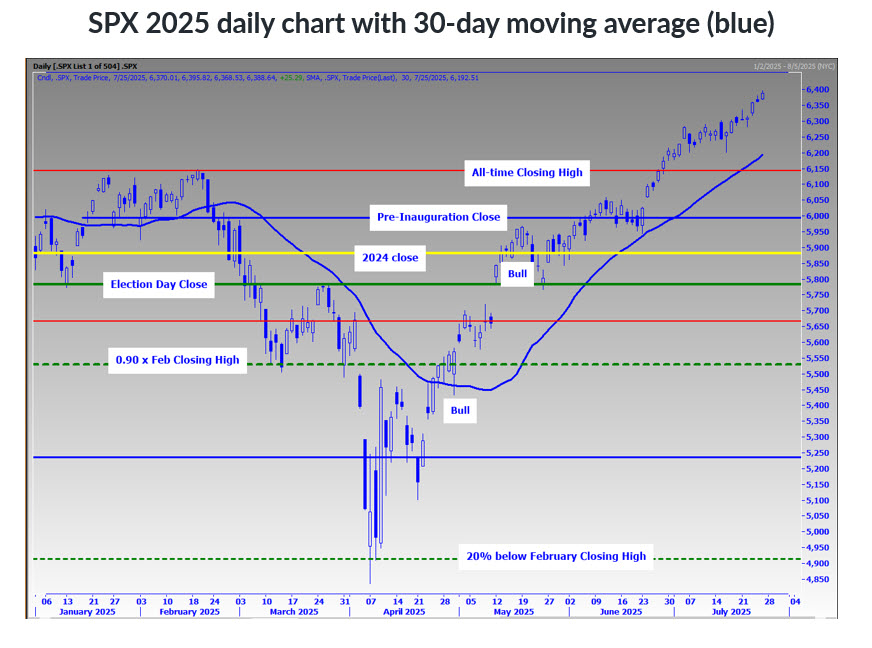
With Friday’s close at 6,388, the index might be considered in “no-man’s” land, with respect to the first area of support nearly 200 points below Friday’s close. That support area is defined by 6,144 (its former all-time closing high in February) and 6,193, which is the site of the rising 30-day moving average (projected to be at 6,248 by this week’s end).
For what it is worth, the SPX has not experienced a convincing close below its 10-day moving average since June 20. This trendline comes into the week sitting at 6,310 and is projected to be at 6,363 this coming Friday. A solid close beneath this moving average could indicate slowing momentum relative to the momentum we have seen since the June 24 gap higher.
If there is a hesitation or pivot point in the future, the best guess is that it occurs around 6,470, or 82 points above Friday’s close. The 6,470-level is 10% above the SPX’s 2024 close.
From an options-related perspective, the SPX 6,450 call strike is the second largest call open interest in Friday options expiring through August standard expiration. This could act in concert with the 6,470-level discussed above to establish a short-term ceiling if these levels are in the cards.

Todd Salamone is Schaeffer's Senior V.P. of Research
Continue Reading: