Earnings Season Highlights

Refresh your browser for the latest updates!
A collection of noteworthy post-earnings reactions
Published on Jul 15, 2025 at 9:15 AM
Updated on Jul 15, 2025 at 9:19 AM
  • Opening View
 
Published on Jul 14, 2025 at 4:23 PM
Updated on Jul 14, 2025 at 4:24 PM
  • Market Recap
   
Published on Jul 14, 2025 at 3:07 PM
  • Buzz Stocks
at $3
Published on Jul 14, 2025 at 2:45 PM
  • Quantitative Analysis

Palo Alto Networks Inc (NASDAQ:PANW) stock was last seen up 2% to trade at $191.11, while also sporting a 13.7% year-over-year lead. The equity is rebounding after dropping to its lowest level since May 30, following two failed attempts to conquer a Feb. 19, record high of $208.39. The stock could soon push back toward those highs, however, as the recent pullback placed it near a historically bullish trendline.

According to Schaeffer's Senior Quantitative Analyst Rocky White, PANW is within one standard deviation of its 200-day moving average. Shares were above this this trendline in at least eight of the last 10 trading days, and spent 80% of the past two months above it. Within these parameters, seven other signals occurred over the past five years, after which the stock was higher one month later 86% of the time, averaging a 11.7% gain. Should a move of similar magnitude happen, the shares could notch a fresh record of $213.46.

PANW 200 Day

Additional tailwinds could stem from an unwinding of pessimism in the options pits. This is per the security's Schaeffer's put/call open interest ratio (SOIR) of 1.27, which stands in the 72nd percentile of readings from the past 12 months. 

Options look like an affordable route for those looking to benefit from the security's next moves. This is per the stock's Schaeffer's Volatility Index (SVI) of 32%, which sits in the 5th percentile of its annual range. This means options traders are pricing in low volatility expectations.

Published on Jul 14, 2025 at 2:11 PM
  • Most Active Options Update

Nvidia Corp (NASDAQ:NVDA) stock made history last Thursday, after the chipmaker became the first company in history to cross the $4 trillion market capitalization level. With the shares currently pacing for a five-day win streak and near their July 11, all-time high of $167.89, options traders are focused on calls.

NVDA consistently tops Senior Quantitative Analyst Rocky White's list of equities with the highest options volume over the past two weeks. Over the last 10 sessions, security saw 19,582,022 calls and 12,020,483 puts traded, by far the most active. Top trades during this timeframe were August 160 calls, along with September 130 and 140-strike calls, where credit spread activity is detected.

MAO NVDA Options

Nvidia stock is a behemoth -- up 22% in 2025 and 27% year-over-year -- but keep an eye on its 14-Day Relative Strength Index (RSI). The recent rally has the RSI above 75, nearing "overbought" territory, per the chart below. This suggests a short-term correction could be imminent.

MAO NVDA

Premium is affordably priced, per the stock's Schaeffer's Volatility Index (SVI) of 36% that ranks in the 2nd percentile of its annual range, implying that options players are pricing in lower-than-usual volatility expectations.

Published on Jul 14, 2025 at 12:06 PM
  • Midday Market Check

Published on Jul 14, 2025 at 10:45 AM
  • Buzz Stocks

Tylenol parent Kenvue Inc (NASDAQ:KVUE) is up 1.4% to trade at $21.64, after the company fired its CEO Thibaut Mongon amid efforts to revamp performance. Mongon also stepped down from his position on the board, as Kirk Perry was named interim CEO. This marks the second C-suite shakeup for Kenvue this year, after Chief Financial Officer (CFO) Paul Ruh was replaced with Amit Banati in May. The company also said tariffs could create a negative impact of up to $150 million.

KVUE is eyeing a fourth-straight win, a streak not seen since the last week of April. Today's pop has pushed the equity back above its year-to-date breakeven mark, with the shares now contending with the overhead 100-day moving average.

Options traders are flocking to the shares in response to today's news, with 17,000 calls and 4,507 puts exchanged so far, double the average intraday rate. Most popular are the November 23 and 24 calls. 

Options traders have been bullish on the security for some time. At the International Securities Exchange (ISE), Cboe Options Exchange (CBOE), and NASDAQ OM X PHLX (PHLX), KVUE's 50-day call/put volume ratio of 37.42 ranks in the 95th percentile of annual readings.

Echoing this, short-term traders are also sporting a call-bias. This is per the security's Schaeffer's put/call open interest ratio (SOIR) of 0.19, which stands in the 2nd percentile of readings from the past 12 months. 

Published on Jul 14, 2025 at 10:44 AM
  • Analyst Update

Though shares of buy-now-pay-later name Affirm Holdings Inc (NASDAQ:AFRM) have pared some of their premarket losses, the equity remains down 1% at $64.06, after a downgrade from BTIG Research to "neutral" from "buy." The firm cited increased competition from traditional lenders such as Capital One Financial (COF) and Synchrony Financial (SYF) due to loosening underwriting standards. 

Headed for its third-straight daily drop, AFRM is pulling back from a rally that ended in four-month highs earlier this month. The 40-day moving average, which provided support in April-May, still lingers below at the $60 level, however. Year-to-date, the equity is up 5%. 

In the options pits today, while call volume is still higher on an absolute basis with 11,000 calls exchanged, the 8,293 puts exchanged represents triple the put volume typically seen at this point. The March 70 call is the most popular, followed by the July 63 put, with new positions being sold to open at the latter. 

Though short interest has been unwinding, it still represents 5.3% of the stock's available float. It would take shorts over two days to cover, at AFRM's average pace of trading. 


Published on Jul 14, 2025 at 10:39 AM
  • Buzz Stocks
  • Analyst Update

Electric vehicle (EV) stock Rivian Automotive Inc (NASDAQ:RIVN) is down 2.9% to trade at $12.65 at last check, after a downgrade from Guggenheim to "neutral" from "buy" to go with a price-target cut to $16. The analyst in coverage cited the likelihood of softer long-term sales of its R2 and R3 cars.

Most brokerages are already skeptical of RIVN, but there is room for additional bear notes, as eight of 26 firms carry still a "buy" or better rating. Plus, the 12-month consensus target price of $15.10 is a 19.5% premium to current levels. Shorts are firmly in control, though, with 19.7% of the stock's available float sold short.

Rivian is fresh off a second-straight weekly loss and carries a 5% deficit for 2025 in addition to its steeper 30.2% year-over-year decline. Amid pressure from their descending 20-day moving average, the shares have carved a channel of lower lows since a 2025 peak at $17.15 on May 20.

Short-term options traders lean bullish. This is per the security's Schaeffer's put/call open interest ratio (SOIR), which sits in the 14th percentile of annual readings. An unwinding of this optimism could create more headwinds for Rivian Automotive stock going forward.

Published on Jul 14, 2025 at 8:49 AM
Updated on Jul 14, 2025 at 9:19 AM
  • Monday Morning Outlook

 “As such, a risk to bulls, with the above technical levels in mind, is the Trump administration sounding ‘less friendly’ in the days and weeks ahead as they attempt to iron out trade deals and in the context of the SPX’s recovery as trade war de-escalation took root.”

          -Monday Morning Outlook, May 19, 2025

In mid-May, with the S&P 500 Index (SPX—6,259.75) trading back above its 2024 and Election Day 2024 closes, I observed a risk related to President Donald Trump’s shifting strategies with respect to tariffs. As stocks sold off sharply in February and March, driven by the Trump Administration’s announcement of huge tariffs on trade partners around the world, Trump told us not to pay attention to the stock market and instead on the direction of oil prices, which were headed lower.

But there is evidence that Trump was paying attention to stock prices, as the early April shift to kick the can down the road with respect to the “Liberation Day” tariffs occurred at the precise time the SPX was trading 20% below its February all-time closing high – a bear market according to some technicians.

If I am correct about the timing of taking a slightly softer stance on tariffs with respect to equity prices, it would only be natural that Trump might become bolder on tariff strategy amid a recovery in stock prices. 

Barometers of a “recovery” at the time that could have made the Trump Administration bolder include:

  1. The SPX above its year-end 2024 close at 5,882.
  2. The SPX above the 2024 Election Day close of 5,783.
  3. The SPX above the pre-Inauguration Day close of 5,995.
  4. An all-time high in the SPX above the February closing high of 6,144.
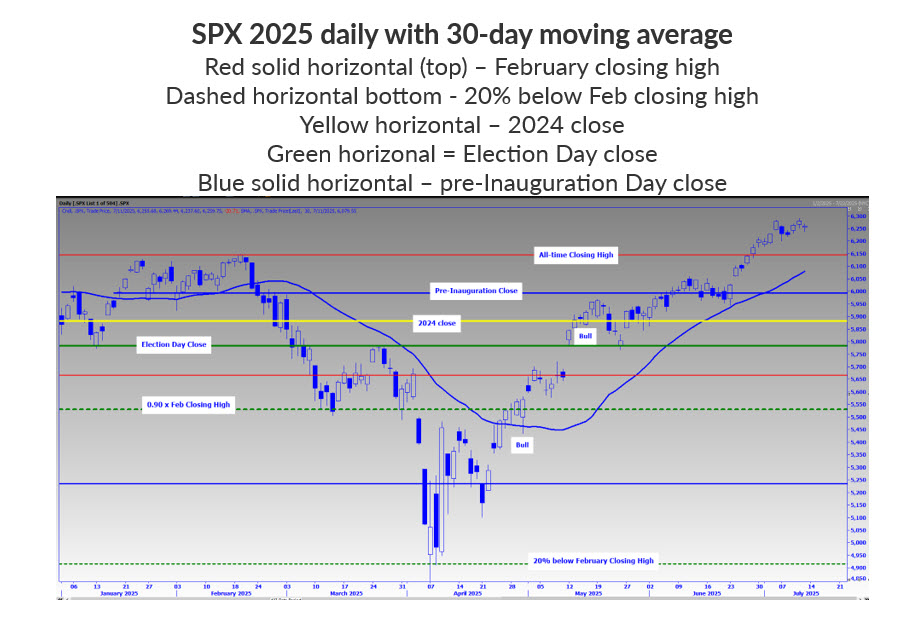
SPX 30-Day Chart

With Trump observing that the SPX is at all-time highs on Truth Social, he is becoming bolder, threatening to double tariffs on many countries and imposing 50% levies on a key trading partner (Canada), in addition to ratcheting up pressure on Brazil and Vietnam last week. 

With the new Aug. 1 deadline approaching and Trump’s rhetoric on tariffs becoming more threatening, the excerpt below from Friday's Bloomberg Markets Daily was interesting, in the context of the remarks I made in mid-May with respect to stock prices and tariffs.

Donald Trump has the markets on his side in the trade war right now, and he knows it. That has some market watchers worried that investors’ calm reaction to his latest pronouncements will only embolden him to keep ratcheting up the tariffs, raising the risk of overreach that ultimately sends stock and bond prices sinkingThe VIX index of US equity volatility dropped this week to the lowest since February, while an equivalent measure of fluctuations in the Treasury market fell to the lowest since 2022.”

          -Bloomberg Markets Daily, July 11, 2025

Based on my mid-May comments, it is hard to disagree on risks associated with the Trump administration raising tariffs significantly, and that if such actions come, it will occur when stocks are performing well, not plummeting as they were in February and March.

No one knows what this administration will do. Amid the tariff uncertainty, the best course of action is to key in on price action and separate threats from actions. In other words, it's a risk that Trump will follow through with threats, but judging by price action, the market is viewing these threats as simply that, for now.

The VIX is sitting at multi-month lows amid the increasing tariff threats and looming Aug. 1 deadline. However, when looking at one-month and two-month VIX futures prices and weighting each to create a 30-day continuous VIX futures interpolated contract, the 30-day futures contract is trading at more than a 15% premium to the VIX. 

Senior Quantitative Analyst Rocky White will dive further into the implications in his Indicator of the Week column posted on our website Wednesday mornings. His “at the surface” research before slicing and dicing other angles suggests that when the 30-day VIX futures interpolated contract is trading at a premium of more than 15% (bold in the tables below), the market tends to underperform one to two weeks later, relative to when the premium is smaller or when the VIX is trading above the 30-day futures contract. 
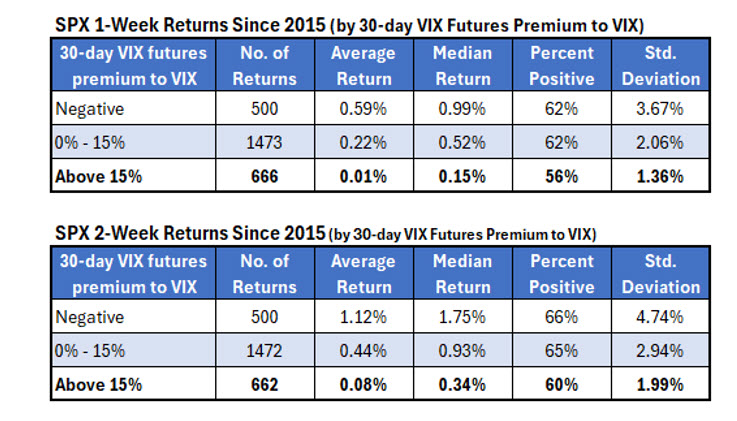
SPX VIX Premium

Amid SPX all-time highs and low VIX readings -- which might make hedging attractive to some of you -- a chart that crossed my desk late last week was easy on the eye for bulls who have a contrarian mindset.

Short interest data was released by the exchanges last week, and we found that total short interest on SPX components increased by 5% from the report two weeks earlier. The SPX managed gains amid the short interest build headwind, nonetheless.
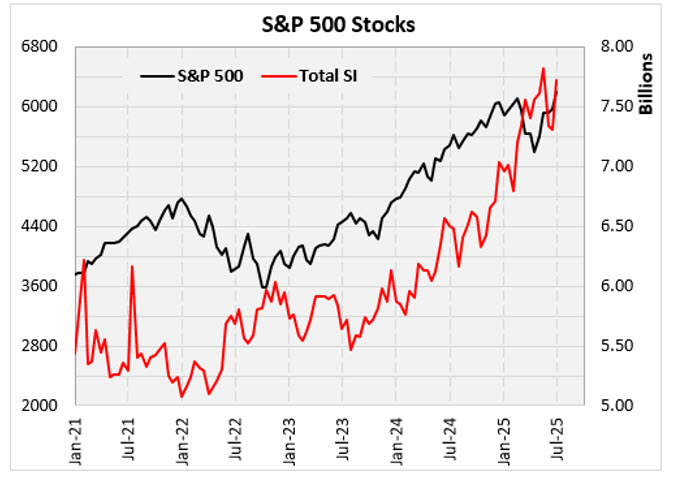
SPX Short Interest

Since early 2024, this continues to be a highly shorted market with total short interest on SPX components near a multi-year high. Amid the strong technical backdrop and evidence of naysayers, the naysayers are seen as a source of support on pullbacks and/or fuel for a sustained move higher, as they feel more pain.

From a short-term perspective, trader optimism is increasing in some areas of the market, evidenced by the low VIX reading relative to the 30-day interpolated VIX futures contract we created. Survey data, such as last week’s National Association of Active Investment Manager (NAAIM) survey reading of 86 out of 100, is showing increased optimism. The reading at this year’s SPX trough was 50.

If the market does pull back to wash out increasing trader optimism, I see the first level of potential support at 6,144, the former all-time closing high in February. Another potential support level is the rising 30-day moving average, currently at 6,080, but projected to be around 6,130 by the end of the week.

In fact, with standard July expiration week upon us, a pullback to the area between 6,130 and 6,144 on Friday would be welcomed by SPY option premium sellers, as an enormous number of SPDR S&P 500 ETF Trust (SPY—623.62) put and call options would expire worthless if the SPY is in the 613-615 vicinity at the end of the week. 
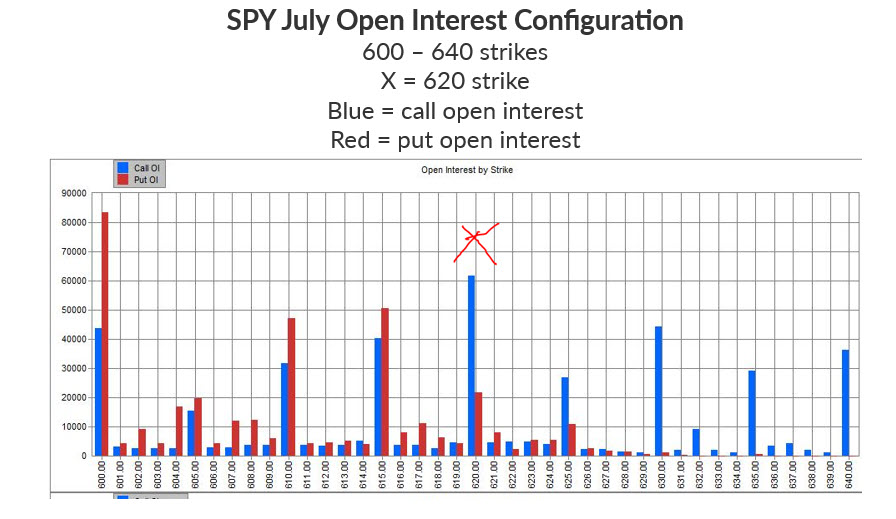
SPY July OI

Todd Salamone is Schaeffer's Senior V.P. of Research

Continue Reading:

Published on Jul 14, 2025 at 9:04 AM
Updated on Jul 14, 2025 at 9:04 AM
  • Opening View
 
Published on Jul 11, 2025 at 4:24 PM
  • Market Recap
   

Begin the New Year With Schaeffer's 7 FREE 2022 Stock Picks!

1640638248


MORE | MARKETstories


3 Cybersecurity Stocks to Watch Amid Sector Meltdown
Fortinet issued a lackluster fiscal third-quarter forecast
AI Infrastructure Stock Quietly Keeps Climbing
NBIS is on track for its best day ever after the company's outstanding revenue beat