Earnings Season Highlights

Refresh your browser for the latest updates!
A collection of noteworthy post-earnings reactions
Published on Aug 20, 2018 at 8:45 AM
Updated on Mar 19, 2021 at 7:15 AM
  • Monday Morning Outlook

The U.S. equity market remains in a sweet spot, despite negative headlines early last week that pushed stocks lower, albeit only briefly. Weakness in the Turkish lira and a negative earnings reaction from Chinese Internet company Tencent Holdings were enough to push the SPDR S&P 500 ETF Trust (SPY - 285.06) down to an area of important support.

Specifically, the SPY successfully tested the put-heavy 280-strike, which corresponds to the round 2,800 century mark on the S&P 500 Index (SPX - 2,850.13). Moreover, the SPY retreated below its Aug. 1 close of $280.86 on an intraday basis, but never closed below this level. And after Thursday's strong advance from support, the SPY remains on target to register another gain in the month following a Federal Open Market Committee (FOMC) decision to hold rates steady.

Also, the SPY pullback was held in check by its 30-day moving average -- similar to late May, when a pullback to this trendline was contained not long after the Fed's decision to hold rates steady. That pullback was followed by an impressive three-week rally that was eventually halted, ironically, at $280, which is now support.

spy 30-day moving average 0817

"...something that has grabbed my attention when listening to a long line of guests on financial television during the past few weeks is the near-consensus opinion that earnings will drag stocks out of their recent funk. The thinking in this group is that investors will get back to focusing more on company-specific fundamentals, and less on the macro issues that have been holding the market back."
-- Monday Morning Outlook, April 16, 2018

"Upbeat reports by corporate America may not be enough to cheer investors dispirited by an escalating trade clash between the world's two largest economies that imperils market access."
-- Bloomberg, July 10, 2018

For what it's worth, earnings reactions have had a net positive influence on the market in the past few weeks, even though the late-July plummet in Facebook (FB) after earnings has been the "headliner." I find this fascinating, given that prior to the start of earnings season last month, the fear was that individual company earnings would take a back seat to macro issues -- such as the trade war between the U.S. and China. This directly contrasted to the sentiment expressed prior to the release of earnings in the prior quarter, when the belief was that macro issues would take a backseat to individual company earnings.

The table below sheds light on earnings reactions among SPX component stocks during this reporting season relative to previous quarters. During this earnings season, 55% of companies reacted positively to earnings, which is the highest percentage going back to 2015. Moreover, nearly 16% saw a share price gain of 5% or more -- the second highest percentage going back to 2015.

However, in the prior quarter, only 47% of SPX stocks gained in reaction to earnings, which is the second lowest going back to 2015. And 16% of those companies saw their shares lose 5% or worse, marking the second highest going back to 2015.

Retailers will be a group to watch closely this week, as many are on deck to report earnings.

spx earnings reactions 3Q 2018

"Amid the potential short-term tailwinds from the Fed's hold last week and a sentiment backdrop that could supply buying power, there is resistance immediately overhead on multiple equity benchmarks that could slow or hinder a rally... Resistance on the Invesco QQQ Trust (QQQ - 180.08), the large-cap technology exchange-traded fund (ETF), is at $180, which is 50% above its 2000 peak. The SPX could incur resistance at its January closing high of 2,872... Meanwhile, smaller-cap indexes, such as the Russell 2000 Index (RUT - 1,673.37) and S&P MidCap 400 Index (MID - 2,000.04), continue to struggle with round-number resistance at 1,700 and the 2,000 millennium mark, respectively."
-- Monday Morning Outlook, August 6, 2018

Even though equity benchmarks are higher since the Fed held rates steady on Aug. 1, it is clear that they continue to struggle with taking out the psychologically significant round-number resistance levels that I cautioned you about two weeks ago. The Invesco QQQ Trust (QQQ - 179.86) has had difficulty trying to sustain a move through the $180 area, which is a natural profit-taking zone for those who bought the breakout above the 2000 high.

And the Russell 2000 Index's (RUT - 1,692.95) struggles continue at the round 1,700 level, which hovers just above a profit-taking zone corresponding with the round 10% year-to-date (YTD) return, seen in the first pane on the chart below. Bulls are hoping for a breakout from a symmetrical triangle pattern that has been developing since June.

rut daily - 1700 level

Meanwhile, the SPX is facing resistance from the 2,850 half-century mark in recent weeks, with the January closing high of 2,872 lingering just above.

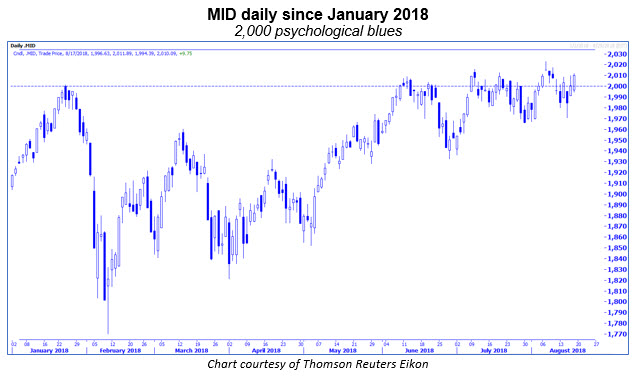
But perhaps the most intriguing struggle is the S&P MidCap 400 Index (MID - 2,010.19) at the 2,000 millennium level. Note that it was first tested in January, and this first test marked the beginning of a 10% correction. Since June, the MID has been dancing around 2,000 on a regular basis.

The MID's price action here reminds me of 2011, when the index experienced a 27% pullback not long after touching 1,000 for the first time in May of that year. December 2012 marked the first sustained move through 1,000. Bulls hope that this eight-month battle with 2,000 does not turn into a 19-month battle, similar to what happened with the 1,000 level.

mid daily 2000 level

On the heels of a solid earnings season and the Fed holding rates steady earlier this month, I think there is enough buying power to push stocks through resistance before the Fed meets in late September. Per the chart below, short-term traders were as negative as they've been in months ahead of the FOMC meeting and this earnings season. With the 10-day equity-only, buy-to-open put/call volume ratio rolling over from a relatively high level, this could signal that short-term pessimism is unwinding, which is a welcome ingredient to drive equity benchmarks through the resistance levels discussed above.

equity put-call ratio aug 17

Continue reading:

Published on Aug 20, 2018 at 10:55 AM
Updated on Mar 19, 2021 at 7:15 AM
  • Technical Analysis
  • Quantitative Analysis
  • Earnings Preview

Pure Storage Inc (NYSE:PSTG) will report earnings after the close tomorrow, Aug. 21. While PSTG stock has moved lower after the cloud concern's last three earnings reports, the shares are trading at a key level right now -- and could be flashing "buy" before earnings.

Pure Storage stock has soared 77% in the past year. However, since touching a record high of $25.62 in mid-June, the equity has pulled back to test its footing in the $21-$22 region. This area represents a 23.6% Fibonacci retracement of PSTG's rally from its early 2017 lows to the aforementioned peak, and is also home to the stock's ascending 160-day moving average.

In fact, PSTG shares are now within one standard deviation of their 160-day trendline, after a lengthy stretch above this moving average. Per data from Schaeffer's Senior Quantitative Analyst Rocky White, there have been two similar pullbacks of this kind -- and both preceded huge gains for the shares. Specifically, PSTG went on to rally 14.96%, on average, a month after those dips. From the security's current perch at $21.90, a similar pop would put the shares around $25.17 -- back near all-time highs.

PSTG stock chart aug 20

On average, PSTG shares have moved 8.7% the day after the firm's last eight earnings reports, regardless of direction. This time around, the options market is pricing in a much bigger 14.8% move for the equity.

In the past two weeks, long calls have been picked up at an unusually fast pace. On the International Securities Exchange (ISE), Chicago Board Options Exchange (CBOE), and NASDAQ OMX PHLX (PHLX), speculators bought to open nearly 36 Pure Storage calls for every put in the past 10 days. The resultant 10-day call/put volume ratio of 35.96 is in the 85th percentile of its annual range, pointing to a much healthier-than-usual appetite for purchased calls over puts of late.

However, some of that call buying -- particularly at out-of-the-money strikes -- could be attributable to short sellers seeking an options hedge ahead of earnings. Short interest represents more than 10% of the stock's total available float, or more than eight sessions' worth of pent-up buying demand, at PSTG's average pace of trading. Should the company report strong earnings tomorrow night, a short squeeze could propel the shares higher.

Published on Aug 20, 2018 at 11:05 AM
Updated on Mar 19, 2021 at 7:15 AM
  • Technical Analysis
  • Earnings Preview

Retailer TJX Companies Inc (NYSE:TJX) stock is up 0.3% in today's trading, last seen at $100.61, as traders gear up for the company's second-quarter report. The TJ Maxx parent is scheduled to share its quarterly results before the market opens tomorrow, Aug. 21. Below, we will take a look at how the retail giant has been faring on the charts, as well as to what the options market is pricing in for the stock's post-earnings moves.

TJX stock has been in a long-term uptrend on the charts, seeing a surge of more than 31% year-to-date, with a line of support stemming from the rising 40-day moving average. In fact, the shares touched a record peak of $101.49 on Aug. 13.

Daily Chart of TJX With 40MA

Looking at TJX's earnings history, the stock has closed higher or flat the day after the company reported in three of the last four quarters, including a 6.9% surge in February, after the company reported solid same-store sales. Looking back eight quarters, the shares have moved 3.2% the day after earnings, on average, regardless of direction. This time around, however, the options market is pricing in a larger-than-usual 5.6% move for Tuesday's trading.

Digging deeper, options traders have been heavily bullish in recent weeks. Data from the International Securities Exchange (ISE), Chicago Board Options Exchange (CBOE), and NASDAQ OMX PHLX (PHLX) shows the the equity's 10-day call/put volume ratio of 5.60 in the 93rd annual percentile. In other words, TJX calls have been purchased over puts at a faster-than-usual clip in the past two weeks.

Echoing this, short-term traders are more call-skewed than usual, with the security's Schaeffer's put/call open interest ratio (SOIR) of 0.38 ranking in the 7th percentile of its annual range. This indicates that near-term call open interest outweighs put open interest by a wider-than-usual margin right now.

Moving toward analyst sentiment, just this morning, Jefferies hiked its price target on TJX to $98. However, that still represents a discount to the equity's current perch. Echoing that, despite TJX stock's recent quest for record highs, seven of 22 analysts following the shares maintain tepid "hold" or worse ratings, and the average 12-month price target sits at just $100.05. A solid earnings showing tomorrow could fuel a round of upgrades and price-target hikes for the retail concern.

Published on Aug 20, 2018 at 11:32 AM
Updated on Mar 19, 2021 at 7:15 AM
  • Technical Analysis
  • Quantitative Analysis

Advanced Micro Devices, Inc. (NASDAQ:AMD) has had a meteoric rise in 2018, and last Tuesday broke through the $20 level to notch an 11-year high of $20.28. Our data suggests the chip stock has room to run even higher in the weeks ahead, as this recent share price high occurred simultaneously with a low-volatility signal -- a combination that's had historically bullish implications for AMD. 

Specifically, the equity's Schaeffer's Volatility Index (SVI) -- a measure of front-month, at-the-money implied volatility (ATM IV) -- currently stands at just 42%. This SVI arrives in the 13th percentile of its annual range, indicating that speculative players have priced in lower volatility expectations for AMD stock options just 13% of the time in the past year.

This combination of a high stock price and low IV has yielded bullish returns for AMD in the past, according to Schaeffer's Senior Quantitative Analyst Rocky White. Since 2008, there have been four occasions where AMD was trading within 2% of its annual high while its SVI was simultaneously in the 20th annual percentile or lower. Following those signals, the security was up 9.37% one month later, on average, with 75% of those returns positive. From AMD's current price of $19.47, a move of similar magnitude would put the chip stock around $21.29 this time next month. 

Looking at the charts, AMD stock has more than doubled from its April 2018 lows near $9. Since a late-April bull gap, the shares have been guided higher by their ascending 40-day moving average. Plus, the security is currently on track for its fifth consecutive monthly gain.

Daily Stock Chart AMD

Despite a recent Goldman Sachs upgrade, there is ample room for more bullish notes. Of the 20 brokerages covering AMD, 10 still rate the shares a "hold" or "strong sell." In addition, its average 12-month price target of $18.28 represents a discount to the stock's current price. Any upgrades or price-target hikes from this group could give AMD's rally an extra boost in the short term.

Short covering could also be a boon. Short interest accounts for more than 20% of AMD's float, even as the equity remains within striking distance of its new multi-year high. Going forward, the unwinding of these bearish bets could fuel more upside for the chip stock.

Published on Aug 20, 2018 at 12:20 PM
Updated on Mar 19, 2021 at 7:15 AM
  • Technical Analysis
  • Quantitative Analysis

It's been a rough month for Weight Watchers International, Inc. (NYSE:WTW), which is down nearly 20% so far in August on a negative earnings reaction and news the company's top investor trimmed its stake. However, the Oprah-backed stock is now trading near a trendline that's had bullish implications in the past -- suggesting WTW shares could be ready to bounce.

wtw stock daily chart aug 20

Specifically, WTW stock is now trading within one standard deviation of its 200-day moving average. According to Schaeffer's Senior Quantitative Analyst Rocky White, there have been three other times since 2015 that Weight Watchers has pulled back to this trendline after a lengthy stint above it, resulting in an average five-day return of 7.78%, with two-thirds of the returns positive.

Broadening the time frame to one month later, WTW was higher each time, averaging a gain of 16.1%. Based on its current perch at $72.81 -- up 3.5% today, on track to snap its three-day losing streak -- another rally of this magnitude would put the security back above $84.50.

There's plenty of sideline cash to fuel a big bounce, too. Short sellers, for instance, have been in covering mode recently, with these bearish bets declining roughly 28% between the April 1 and Aug. 1 reporting periods -- a stretch that saw WTW surge almost 41%. The 4.34 million shares still sold short represents almost four days' worth of pent-up buying demand, at Weight Watchers stock's average pace of trading.

Those wanting to bet on a repeat of history for WTW stock may want to consider an options buying strategy. Trade-Alert last pegged the equity's 30-day at-the-money implied volatility at 38.3%, registering in the 10th annual percentile. This means that short-term options are pricing in low volatility expectations at the moment.

What's more, Weight Watchers has consistently been one of the best stocks for premium buyers over the last year, per its elevated Schaeffer's Volatility Scorecard (SVS) reading of 79 out of a possible 100. In other words, WTW has tended to make outsized moves in the past 12 months, relative to what the options market was anticipating.

Published on Aug 21, 2018 at 7:54 AM
Updated on Mar 19, 2021 at 7:15 AM
  • Quantitative Analysis
  • Editor's Pick

FAANG stock Netflix, Inc. (NASDAQ:NFLX) snapped a six-session losing streak on Monday, after the streaming content provider confirmed a plan to test video ads for other Netflix series. While many Netflix users are voicing displeasure with the segmented test -- and while some analysts are concerned about competition and the impact of Netflix's original content on the company's profit margins -- NFLX shareholders didn't seem too concerned yesterday, sending the stock up 3.5% to land at $327.73. What's more, if recent history is any indicator, the FAANG stock could outperform in the next few months.

There have been 25 six-day losing streaks since NFLX stock began trading in 2002, according to Schaeffer's Senior Quantitative Analyst Rocky White. Prior to this month's, the last streak of this magnitude was in late April, just after the stock skyrocketed on strong subscriber growth. Prior to that, you'd have to go back to January 2016 for a losing streak of at least six days. The security's longest losing streak came in March 2014, which lasted 11 days.

NFLX losing streaks since 2010

Historically, NFLX shares have remained weaker than usual the week after six-day losing streaks. The stock averaged a one-day and one-week loss after these streaks, and was positive just 41.7% of the time. That's compared to an average anytime one-day and one-week gain for the shares.

However, one month after a streak, NFLX stock was up 6.34%, on average, and higher 62.5% of the time. That's compared to an average anytime one-month gain of 4.53%. Three months out, Netflix shares were up 19.06%, on average -- exceeding their average anytime three-month return of 14.77% -- and higher two-thirds of the time.

NFLX after losing streaks since 2002

In conclusion, if past is prologue, now could be an opportune time to jump on the FAANG stock's next leg higher. As we mentioned last week, the shares have pulled back to their 160-day moving average, which has had bullish implications in the past. The stock also tested a foothold in the $315 area -- representing a 61.8% Fibonacci retracement of its rally from a January bull gap to its June 21 record high of $423.20. Another 19.06% jump in the next three months would place the security around $390.

NFLX stock chart aug 21

Published on Aug 21, 2018 at 12:53 PM
Updated on Mar 19, 2021 at 7:15 AM
  • Intraday Option Activity
  • Earnings Preview

Target Corporation (NYSE:TGT) stock is down 0.3% at $83.04 in afternoon trading, as investors gear up for the company's impending earnings report. The retail giant is slated to release its second-quarter earnings before the market opens tomorrow, Aug. 22. Below we will dive into Target's earnings history, as well as how TGT stock has been faring on the charts, and what options traders are expecting.

TGT has been in a long-term uptrend, gaining 47% in the past year. Pullbacks earlier this year were contained by a floor of support near $69 and the 120-day moving average. Since its latest bounce off support, Target stock touched a two-year high of $84.13 on Aug. 17.

Daily Chart of TGT with 120MA and Highlight

Looking at TGT's earnings history, the stock has closed lower the day after the company reported in five of the last eight quarters, including the last three in a row. Looking back all eight quarters, the shares have moved 6.2% the day after earnings, on average, regardless of direction. This time around, the options market is pricing in a slightly larger-than-usual 8.8% move for Wednesday's trading.

Digging deeper, short-term traders are more call-skewed than usual, with its Schaeffer's put/call open interest ratio (SOIR) of 0.34 ranking in the lowest percentile of its annual range. This indicates that near-term call open interest outweighs put open interest by a wider-than-usual margin right now.

Today, however, put options are flying off the shelves at three times the average intraday pace, with 13,000 traded so far. Most of the action appears attributable to spread activity in the weekly 8/24 series. It appears the speculator may have initiated a long straddle at the 82.50-strike put and 88.50-strike call, and helped fund the position by selling to open 77.50-strike puts. If so, the trade was established for $2.25 per trio of options, and will profit if TGT moves above $90.75 (call strike plus net debit) or below $80.25 (bought put strike minus net debit). However, profit potential on a move south of $77.50 is limited, due to the sold put.

Analysts remain uneasy toward Target stock, despite the equity's quest for new highs. Of the 15 firms following the retailer, 11 sport tepid "hold" or worse ratings. Plus, the stock's average 12-month price target of $79.87 represents a 4% discount to current trading levels.
Published on Aug 21, 2018 at 2:03 PM
Updated on Mar 19, 2021 at 7:15 AM
  • Technical Analysis
  • Quantitative Analysis

Healthcare stocks have been on a tear lately, and if recent history is any indicator, two could be flashing "buy" right now. Specifically, Progenics Pharmaceuticals, Inc. (NASDAQ:PGNX) and EXACT Sciences Corporation (NASDAQ:EXAS) stocks recently pulled back to key trendlines, which could mark an opportune entry point for short-term bulls.

PGNX Bounce Could Squeeze Shorts

Shares of cancer treatment concern Progenics touched an annual high of $9.41 on Aug. 6, but have since retreated to trade at $7.93. The stock is now within one standard deviation of its 160-day moving average, which has marked big buying opportunities in the past. Specifically, after the last four similar pullbacks, PGNX stock went on to rally an average of 10.33% in the subsequent month, per data from Schaeffer's Senior Quantitative Analyst Rocky White.

PGNX stock chart aug 21

Should Progenics stock once again bounce off this moving average, a short squeeze could add fuel to the fire. Short interest jumped more than 10% in the most recent reporting period, and now accounts for nearly 17.5% of PGNX's total available float. At the security's average pace of trading, it would take about seven sessions to buy back these bearish bets.

Traders looking to speculate on PGNX's short-term trajectory should consider options. The equity's Schaeffer's Volatility Index (SVI) of 57% is in the 8th percentile of its annual range, suggesting near-term options are pricing in relatively low volatility expectations right now.

EXAS Options Attractive After Bear Gap

The shares of molecular diagnostics issue Exact Sciences gapped lower on Aug. 2, after the company's quarterly revenue fell short of estimates. Nevertheless, Canaccord Genuity analysts said that despite "confusion" during the earnings conference call, the stock's reaction was "overblown," and investors should "buy off the sharp sell-off."

EXAS, in fact, could be flashing "buy" after the dip. The stock is not only oversold, per Monday's 14-day Relative Strength Index (RSI) of 29, but it's back within one standard deviation of its 320-day moving average, after a notable stint north of the trendline. After the two prior signals of this kind, the security was higher one month later both times, boasting a massive average gain of 28.92%, per White. A similar jump from the stock's current perch at $50.07 would place Exact Sciences shares around $64.50.

EXAS stock chart aug 21

As with Progenics, should EXAS once again skyrocket off trendline support, shorts could hit the bricks. Short interest represents more than 9% of the stock's total available float, or about seven sessions' worth of pent-up buying demand, at the equity's average trading volume.

Plus, EXAS' SVI of 39% is in the 7th percentile of its annual range, pointing to attractively priced short-term options, from a historical volatility standpoint. What's more, EXAS sports a Schaeffer's Volatility Scorecard (SVS) of 85, suggesting the equity has made bigger-than-expected moves on the charts in the past year, relative to what the options market priced in -- a boon for would-be premium buyers.

Published on Aug 21, 2018 at 2:25 PM
Updated on Mar 19, 2021 at 7:15 AM
  • Technical Analysis
  • Earnings Preview

Retail earnings are hot this week, with L Brands Inc (NYSE:LB) set to unveil its second-quarter report set to hit after the market closes tomorrow, Aug. 22. Ahead of the event, the stock is down 2.1% at $32.39, after RBC Capital lowered its price target to $35 from $40, citing a lack of value for LB brand Victoria's Secret.

A long-term underperformer, LB has shed more than 46% year-to-date, and touched a six-year low of $30.42 on July 25. The stock recently rallied into overhead resistance at its 40-day moving average, which, according to data from Schaeffer's Senior Quantitative Analyst Rocky White, may indicate that it could be an attractive time to bet on LB's next leg lower.

Per White, L Brands shares are now within one standard deviation of their 40-day moving average, after a lengthy stretch below this trendline. There have been nine similar signals of this kind in the past three years, after which LB went on to average a one-week loss of 1.28%, with just 22% of those returns positive. One month later, the stock was lower more than half the time, down an average of 1.98%.

Daily Chart of LB With 40MA

Switching gears to LB's earnings history, the stock has closed lower the day after the company reported in four of the last eight quarters, including a 13.9% drop in early March. On average, the shares have moved 5.9% the day after earnings over this time frame, regardless of direction. This time around, however, the options market is pricing in a larger-than-usual 9.2% move for Thursday's trading.

Options traders have been anticipating a move to the upside. Data from the International Securities Exchange (ISE), Chicago Board Options Exchange (CBOE), and NASDAQ OMX PHLX (PHLX) shows the the equity's 10-day call/put volume ratio of 2.46 in the 93rd annual percentile. In other words, LB calls have been purchased over puts at a faster-than-usual clip in the past two weeks -- though with a healthy 8.2% of the stock's float sold short, some of this could be due to hedging.

Regardless, L Brands stock has consistently rewarded premium buyers over the last year, per its elevated Schaeffer's Volatility Scorecard (SVS) reading of 93 (out of 100). In other words, LB has tended to make outsized moves in the past 12 months, relative to what the options market was anticipating.
Published on Aug 22, 2018 at 7:19 AM
Updated on Mar 19, 2021 at 7:15 AM
  • Indicator of the Week

The S&P 500 Index (SPX) just overtook the all-time high it reached in late January. However, the chart below shows that over the past couple of months, a growing number of stocks have been hitting new 52-week lows. This seems like a bad sign for the market, but time and time again, the numbers don’t always support these kinds of anecdotal conclusions. This week I’m going to look at prior instances to see how stocks performed going forward.

S&P 500 With Stocks New Lows

Index Near Highs & Stocks at Lows  

Using the current list of optionable stocks, I looked at prior times where the S&P 500 was in the top 90% of readings over the past year and at least 8% of stocks had made a new low over the past week. I went back to 2000, but the first signal was not until 2014; probably a result of survivorship bias, as the number of new lows going back a longer time is underreported because stocks at lows are less likely to be trading several years later than stocks at highs. This did, however, give me four other signals to work with, all of which occurred over the past five years.

The table below shows how the S&P 500 did after those four occurrences and then typical index returns since 2015 for comparison. It’s not wise to draw strong conclusions from four data points, but let’s at least look at the results. Interestingly, the signals came in each of the last four summers. The market has been strong after the last two signals, which occurred in June 2016 and June 2017. In both instances, the S&P 500 gained at least 7% over the next six months and double-digits over the next year. Stocks were weak after the two earliest signals, especially after the signal from July 2015.

S&P 500 Near Highs With Stock Lows

Sectors Hitting New Lows

Finally, I was curious where these stocks were coming from that were hitting new lows. The table below shows the number of stocks from specific sectors that have hit new lows over the past week. No one sector dominates the list, but the mining and pharmaceutical/biotech sectors have the most stocks that have hit their 52-week low over the past week

Stock Sectors 52-Week Lows

Published on Aug 22, 2018 at 11:25 AM
Updated on Mar 19, 2021 at 7:15 AM
  • Quantitative Analysis
  • Earnings Preview

Dow stocks Cisco Systems, Inc. (NASDAQ:CSCO) and Microsoft Corporation (NASDAQ:MSFT) have enjoyed steady climbs up the charts in 2018. However, the ride could be far from over, with both stocks recently flashing potential "buy" signals.

Cisco Stock Poised To Extend Weekly Winning Streak

At last check, Cisco stock is up 0.4% today at $46.02, and just yesterday nabbed an 17-year high of $46.43. Overall, the equity added 20% in 2018, and is on track for its sixth straight weekly win.

Daily Stock Chart CSCO

In addition, CSCO's Schaeffer's Volatility Index (SVI) -- a measure of front-month, at-the-money implied volatility (ATM IV) -- currently stands at just 16%. This SVI arrives in the 8th percentile of its annual range, indicating that speculative players have priced in lower volatility expectations just 8% of the time in the past year.

This combination of a high stock price and low IV has had bullish implications for CSCO in the past, according to Schaeffer's Senior Quantitative Analyst Rocky White. Since 2008, there have been five occasions where CSCO has been trading within 2% of its annual high while at the same time its SVI was in the 20th annual percentile or lower. Following those signals, the security was up 4.1% one month later, on average, and was higher all five times.

What's more, the equity has consistently rewarded premium buyers over the past year. This is per the stock's Schaeffer's Volatility Scorecard (SVS), which is currently docked at an elevated 87 out of 100. This suggests that Cisco stock has regularly made larger-than-expected moves on the charts, compared to what its options were pricing in.

MSFT Skid Could Have Bullish Implications

Looking at Microsoft, the stock is up 0.1% today at $106.10, on track to snap a five-day skid. That losing streak put MSFT shares within one standard deviation of their 40-day moving average, a trendline with bullish implications in the past. Specifically, after the last 14 similar pullbacks, Microsoft stock went on to rally an average of 3.37% in the subsequent month, per data from White, and was positive 79% of the time. A move of similar proportions would have MSFT closing in on its late-July record high of $111.15.

Daily Stock Chart MSFT

In the options pits, puts have become more popular recently. Data from the International Securities Exchange (ISE), Chicago Board Options Exchange (CBOE), and NASDAQ OMX PHLX (PHLX) shows MSFT with a 10-day put/call volume ratio of 0.60, which ranks in the elevated 80th percentile of its annual range. This means that although calls have outnumbered puts on an absolute basis, the lofty percentile rank indicates puts have been purchased relative to calls at a faster-than-usual clip during the past two weeks -- though some of this could be the result of shareholders initiating an options hedge.

Whatever the motive, it's a prime time to purchase premium on Microsoft options. The equity's SVI of 17% ranks in the 13th percentile of its annual range, indicating low volatility expectations are being priced into its short-term options.

Published on Aug 22, 2018 at 11:46 AM
Updated on Mar 19, 2021 at 7:15 AM
  • Quantitative Analysis
  • Indexes and ETFs
  • Editor's Pick

There has been much debate lately on whether the current bull market is really the longest ever, as the definitions of a bull market vary. While one camp believes the rally that led up to the dot-com bubble bursting in 2000 began in 1990, others say it started in 1987 -- meaning it's longer than the current bull market, which began in March 2009. While we aren't here to argue either case in this space right now, something that isn't up for debate is the last time the S&P 500 Index (SPX) touched a new 52-week low: more than 630 sessions ago, marking the longest such stretch since 2014.

Specifically, the last time the S&P hit a 12-month low was Jan. 20, 2016 -- 634 trading days ago, as of Aug. 17. The last time the index went that long without a new low was April 2014, and prior to that you'd have to go back to September 2011, according to Schaeffer's Senior Quantitative Analyst Rocky White. In fact, there have been just a dozen other times the S&P achieved this feat, going back to 1944 (the first signal). The longest stretch on record ended in November 2000, after more than 2,500 trading days.

SPX 634 days since new low

If past is prologue, strength could beget strength for the S&P in the near term. One month after going this long without a new 12-month low, the SPX was up 1.76%, on average, and higher two-thirds of the time. That's more than double the index's average anytime one-month gain of just 0.71%, with a win rate of 60.9%, per White. Plus, as Schaeffer's Senior V.P. of Research Todd Salamone noted earlier this week, "On the heels of a solid earnings season and the Fed holding rates steady earlier this month, I think there is enough buying power to push stocks through resistance before the Fed meets in late September."

From a longer-term standpoint, though, the SPX could underperform. One year after these signals, the stock market barometer averaged a gain of 5.93%, and was higher just 58.3% of the time. That's compared to an average anytime one-year gain of 8.81%, with a win rate of 73.1%, looking at anytime data since 1944.

SPX after signals vs anytime aug 22

Begin the New Year With Schaeffer's 7 FREE 2022 Stock Picks!

1640638248


MORE | MARKETstories


3 Airline Stocks Enjoying Tailwinds After CPI Reading
UAL is on track for its sixth gain in seven sessions
Sea Stock Rides Q2 Earnings Wave to 3-Year Highs
Tech stock Sea Limited saw gains after reporting its Q2 earnings beat