US markets are closed
Published on Dec 12, 2018 at 11:35 AM
Updated on Mar 19, 2021 at 7:15 AM
  • VIX and Volatility
  • Indexes and ETFs
  • Editor's Pick

Unless you've been hiding under a rock, you're probably aware that the stock market has been pretty volatile lately, especially compared to the slow burn higher of 2017. Day traders especially might have noticed the massive intraday swings we've experienced lately; for instance, the Dow erased a 500-point deficit to end higher Monday, and traded in a range of 500 points on both sides of breakeven yesterday. So, just how sensitive is Wall Street's proverbial hair trigger right now, and what could that mean for stocks heading into 2019?

The S&P 500 Index (SPX) on Tuesday endured its fifth straight session where it moved at least 2% from its intraday low to its intraday high. The last time this happened -- considering just one signal every 21 days -- was in late October, when stocks were wrapping up a brutal month. Prior to that, you'd have to go back to the "flash crash" of August 2015 for a volatility signal, which was the first of its kind since September 2011, per data from Schaeffer's Senior Quantitative Analyst Rocky White. Below are all of the SPX volatility signals since 1980, of which there are 23.

SPX volatility signals since 1980

It seems stretches of extra volatility tend to beget more volatility, in the short-to-intermediate term, at least. The standard deviation of S&P returns after these stretches is higher than normal, as you can see on the chart below.

As far as performance after signals, it's difficult to get a good read. The SPX was higher than normal in the short term, averaging a one-week gain of 0.73% after signals -- that's more than three times its average anytime one-week return of 0.19%. On the other hand, one month after signals, the index was higher by just 0.05%, on average, compared to 0.79% anytime. Looking six months out, that underperformance continued, with the S&P up a weaker-than-usual 3.9%, and higher just 50% of the time.

SPX after volatility streaks vs anytime

In conclusion, stocks' longer-term trajectory will likely be determined by macro events, like the U.S.-China trade war, the Fed's pace of rate hikes, and possibly even a hard Brexit from the European Union in March. In the near term, at least, traders should watch the S&P's movement between the 2,600 and 2,800 levels, per Schaeffer's Senior V.P. of Research Todd Salamone, and hope that another rough start to December once again bodes well for bulls in the end.

Published on Jan 14, 2019 at 1:03 PM
Updated on Mar 19, 2021 at 7:15 AM
  • VIX and Volatility
  • Quantitative Analysis

Unless you've been hiding under a rock, you're probably aware that volatility has rammed its way back into Wall Street ala the Kool-Aid Man. In fact, 20-day historical volatility (HV) on the S&P 500 Index (SPX) was at 29% to start 2019, compared to just 6.2% heading into 2018, per Schaeffer's Quantitative Analyst Chris Prybal. The last time HVs were that high to start a year was in 2009. Below is what we might expect for the stock market this year, if recent history is any indicator.

Looking back at S&P data since 2000, we divided the years into quartiles, depending on where SPX 20-day HV was to start the year. Last year, for instance, ranked in the first quartile (lowest HVs), second only to 2011. This year started in the fourth quartile (highest HVs), just edging past 2001.

SPX HV quartiles since 2000

Looking at how the rest of the year plays out based on HVs out of the gate, it seems volatility breeds more volatility for the S&P, with both the steepest average loss and biggest average gain coming in that category.

For instance, the SPX was down about 8%, on average, two months into years when HV started strong, yet the index averaged a one-year gain of more than 12% -- the highest by far of any quartile. That compares to an average anytime one-year return of just 5.21%, looking at data since 2000.

SPX returns based on HV

So, if recent history is any indicator, even if the S&P continues to struggle heading into February, the bulls could emerge victorious before we flip the calendar to 2020. What's more, we're already defying the trend of a first-quarter slump, with the SPX up more than 3% at the January midpoint.

In the short term, speculators should keep an eye on short interest trends, as well as the hedge fund crowd. "All indications are these funds have very low stock exposure, and continued accumulation from this crowd could drive the SPX through resistance," according to Schaeffer's Senior V.P. of Research Todd Salamone.

Published on Mar 13, 2019 at 2:21 PM
Updated on Mar 19, 2021 at 7:15 AM
  • VIX and Volatility
  • Quantitative Analysis

Unless you've been hiding under a rock, you're probably aware that the U.S. stock market has been on fire in 2019. In fact, the S&P 500 Index (SPX) is on pace to top the key 2,800 level today, eyeing its highest close since early October, before the massive fourth-quarter sell-off. As such, the Cboe Volatility Index (VIX) -- also known as Wall Street's "fear gauge" -- has cooled its proverbial jets, more than halving since its late-December peak above $36. However, if recent history is any indicator, the VIX could be on the cusp of a breakout.

Specifically, the VIX's Bollinger Bands recently narrowed to within 3.5 points -- a range similar to September, just before the aforementioned sell-off, as you can see on the chart below. Many traders use contracting bands as a signal that the underlying shares will see heightened volatility soon. Against this backdrop, we decided to take a look at how the VIX performs depending on the width of its Bollinger Bands.

VIX chart march 13

To analyze the data, Schaeffer's Senior Quantitative Analyst Rocky White broke down VIX returns into three groups based on the width of its Bollinger Bands: when they're within a range of less than 3.5 points, as we just saw; when they're between 3.5 and 10 points apart; and when they're wider than 10 points. The second grouping is most frequent, with over 4,300 returns since 1990 -- more than double the first grouping, and triple the last grouping.

Following a sub-3.50 signal, the VIX was higher more than 50% of the time at each checkpoint looking six months out. That's compared to a positive rate of 50% or lower across the board after VIX Bollinger Bands are wider. So, it's safe to conclude that the VIX is more likely to move higher when its Bollinger Bands are claustrophobic.

More specifically, two weeks after a sub-3.50 signal, the VIX was up 4.52%, on average -- about three times the average return when its bands were in a "normal" range. That's compared to an average two-week drop of 3.11% when VIX bands are more than 10 points apart.

It's a similar story looking six months out. After a sub-3.50 signal, the VIX was up 14.12%, on average, compared to an average gain of 8.85% after "normal" readings, and an average loss of 17.43% after readings of wide Bollinger Bands.

VIX returns based on BBs

In conclusion, the data above indicates that when VIX Bollinger Bands get pinched -- to less than 3.5 points -- by a cooldown in day-to-day volatility, the "fear index" tends to move higher over the next six months. That's not too surprising, however, as volatility expectations for stocks ebb and flow, and narrowing bands often precede the end of a "quiet period" for the underlying -- in this case, the VIX.

In the short term, traders should monitor the VIX's dance around the 18 level, which represents roughly half the December closing high. A VIX close above this level could be a warning of an imminent spike in volatility, as Schaeffer's Senior V.P. of Research Todd Salamone noted in this week's Monday Morning Outlook. Plus, he added, recent Commitment of Traders (CoT) data indicates the next big VIX move will likely be to the upside, as large speculators have so often been on the wrong side of major volatility moves.

Published on Aug 7, 2019 at 1:44 PM
Updated on Mar 19, 2021 at 7:15 AM
  • Indexes and ETFs
  • Quantitative Analysis
  • VIX and Volatility
  • Editor's Pick

After falling every single day last week, stocks on Monday suffered their worst one-day sell-off of 2019, as the U.S.-China trade war came to a boil. As a result, the Cboe Volatility Index (VIX) -- also known as Wall Street's "fear gauge" -- skyrocketed into territory not charted since early January. In fact, the VIX's surge was so dramatic it set off a signal seen only four other times in the index's history. Below, we take a look at what that could mean for stocks over the next year.

The VIX settled at 12.07 on Wednesday, July 24; by Monday, Aug. 5, it had more than doubled to land at 24.59. Per Schaeffer's Quantitative Analyst Chris Prybal, there have been just five times ever when the VIX skyrocketed 100% or more in a matter of just eight sessions (not considering redundant signals).

The last time it happened was in mid-October 2018, at the start of the fourth-quarter sell-off. The VIX actually tripled in short order back in early February 2018, which marked the first signal since the August 2015 doldrums. In fact, it's interesting that three of the five signals happened in the month of August, with the first occurring in 2011.

VIX chart aug 7

A week after previous signals, the S&P 500 Index (SPX) was higher 100% of the time, averaging a gain of 2.6%. Though it's obviously a small sample size, that's far better than the index's average anytime one-week return of 0.2%, with 60% positive, looking at data since 2011. The S&P also racked up stronger-than-usual returns at the one-, three-, six-, and 12-month markers.

SPX after VIX doubles

And, as you might've guessed from the encouraging SPX stats above, the famously mean-reverting VIX tends to cool off significantly after quick-and-dirty pops. In fact, the "fear index" averages a negative return at every single checkpoint, giving up an average of 22.9% one week later. That's compared to an average anytime one-week gain of 1.3% since 2011. By one year out, the VIX was down more than 60%, on average, compared to an average anytime annual return of 2.1%.

VIX after VIX doubles 2

In conclusion, while stocks are significantly lower again today, history favors the bulls over the long haul after one of these signals. However, the market's near-term trajectory could depend on macro events, including U.S.-China trade negotiations -- expected to resume in September -- and Fed policy. In addition, volatility could remain a factor for a while; note that the standard deviation of S&P 500 returns after these VIX signals is higher than usual at nearly every checkpoint.

Published on Sep 3, 2019 at 2:36 PM
Updated on Mar 19, 2021 at 7:15 AM
  • Editor's Pick
  • VIX and Volatility
  • Quantitative Analysis

The U.S. stock market sold off sharply in August as U.S.-China trade tensions ramped up. The negative price action in equities created a boon for several volatility trackers, including the iPath Series B S&P 500 VIX Short-Term Futures ETN (VXX), which rallied all the way up to a two-month high of $31 by mid-August.

This region coincided with the exchange-traded note's (ETN) 160-day moving average, which has had bearish implications in the past -- and following a swift rejection from here, the shares were trading all the way down to $25.75 by Aug. 22. With VXX once again testing this trendline amid a fresh round of U.S.-China trade headlines, history suggests volatility could ease in September.

Specifically, VXX is now back within one standard deviation of its 160-day trendline after a lengthy stretch below it, defined for this study as having traded south of the moving average 60% of the time in the past two months, and in eight of the last 10 trading days. There have been four similar occurrences in the last three years, and VXX was down 11.9%, on average, one month out, with not a single return positive.

This theory that volatility's about to cool down is being echoed in a descending buy-to-open call/put volume ratio on the Cboe Volatility Index (VIX). In this week's Monday Morning Outlook, Schaeffer's Senior V.P. of Research Todd Salamone notes how a "current lack of intense [VIX] call buying could be indicative of another notable volatility spike not being on the immediate horizon."

Meanwhile, the 20-day call/put volume ratio for VXX across the International Securities Exchange (ISE), Cboe Options Exchange (CBOE), and NASDAQ OMX PHLX (PHLX) currently sits at 1.16 -- up from its early August readings near 1.10. The September 28 strike is home to peak front-month call open interest of 23,290 contracts, and data confirms at least some buy-to-open activity here.

On the flip side, the September 17 put is VXX's top open interest position, with nearly 54,000 contracts outstanding. A number of these options were also bought to open, as volatility traders position for a swing below $17 over the next several weeks. Today, the shares are trading up 5% at $28.34.

vxx daily chart sept 3

Published on Oct 14, 2019 at 1:17 PM
Updated on Mar 19, 2021 at 7:15 AM
  • Quantitative Analysis
  • VIX and Volatility
  • Indexes and ETFs
  • Editor's Pick

It's been a wild October so far for the stock market, as investors have reacted to Fed buzz and updates on U.S.-China trade negotiations. In fact, from Sept. 27 to last Friday, Oct. 11, the S&P 500 Index (SPX) moved at least 0.4% every single session, regardless of direction. That's the first 11-day streak of notable moves in more than 11 months, and only the second such volatility streak since 2011.

Specifically, the last time the S&P moved 0.4% for at least 11 consecutive sessions was in November 2018, during which the index fell 1.07% on its way to the December lows, per data from Schaeffer's Senior Quantitative Analyst Rocky White. During the most recent streak, the SPX essentially went nowhere, losing just 0.25% when all was said and done. Prior to November 2018, you'd have to go back seven years for a similar streak, of which there were three in both 2011 and 2010. Below are the returns after all streaks since 2010.

SPX volatility streaks 1014

After at least 11 straight days of 0.4% swings, the SPX tends to underperform in the short term, looking at data since 2010. On average, the index fell 1.04% over the next two weeks, and was higher just once (in June 2010). That's compared to an average anytime two-week gain of 0.42% for the SPX. A month out, the SPX was higher by 0.62%, on average, though that still underwhelms compared to its average anytime one-month gain of 0.91%.

However, the tide tends to shift in the bulls' favor once you get to three months out. Following a lengthier-than-usual bout of big daily moves, the SPX was up 4.47%, on average, at the three-month marker, and higher 85.7% of the time. That's compared to an average anytime return of 2.71%, with a win rate of just under 75%.

Likewise, six months after a volatility jump, the S&P was up 10.76%, on average -- roughly double its average anytime return of 5.51%. What's more, the stock market index was in the black every single time six months after these streaks, compared to 80.9% anytime.

spx after vol signals since 2010 1014

Looking even further back, the short-term outlook for stocks is brighter. There have been 37 similar volatility streaks for the SPX since 1950. Two weeks out, the index was up an average of 1.14% -- more than triple its average anytime return of 0.34% during the same time frame. Plus, one month later, the S&P averaged a gain of 1.45%, compared to 0.71% anytime.

SPX vol signals since 1950 1014

In conclusion, recent history suggests the S&P could be in for another bumpy few weeks. However, as Schaeffer's Senior V.P. of Research Todd Salamone wrote earlier today, a couple of factors could be supportive of stocks in the weeks ahead, including "the contrarian implications of low earnings expectations as we move into earnings season" this week, and a possible "unwinding of the six-month build in short interest" that could push the SPX above the top of its range.

Published on Oct 29, 2019 at 6:36 AM
Updated on Mar 19, 2021 at 7:15 AM
  • VIX and Volatility
  • Indexes and ETFs
  • Bernie's Content

Everyone loves a good underdog story, and Wall Street investors are of course no exception -- but in the case of the VelocityShares Daily 2x VIX Short-Term ETN (NASDAQ:TVIX), some traders are simply taking this trope too far.

The exchange-traded note (ETN) is one of those leveraged volatility products that you've no doubt been warned about; designed to deliver double the daily return of short-term Cboe Volatility Index (VIX) futures with an average of one month until expiration, TVIX is the type of asset that performs best over time frames measured in mere hours. As such, what initially seems to be a "user friendly" way to make a directional bet on volatility can easily go awry in the hands of an inexperienced investor.

What's more, TVIX faces the same structural pressures as its close cousin, the iPath Series B S&P 500 VIX Short Term Futures ETN (BATS:VXX). Both instruments derive their value from a mix of short-term VIX futures -- which, during a "typical" period of contango, will steadily decline in value over their respective life spans to meet up with spot VIX. As such, you could argue that TVIX and VXX are almost built to lose money in "normal" market environments, while delivering outsized returns during the volatility "melt-ups" that have occasionally rocked stocks in recent years.

With that prologue in mind, the 86.9% decline in TVIX shares this year shouldn't be considered altogether shocking -- nor should Friday's new 52-week low below the $10 level. In fact, that could be considered a relatively respectable performance for the double-leveraged volatility tracker, given that spot VIX itself is down more than 50% since the start of 2019.

Slightly more brow-raising, perhaps, is the fact that net inflows into TVIX since Jan. 1 are now teetering around $1.78 billion, in a show of rather vociferous enthusiasm for this backpedaling ETN. This figure becomes even more remarkable when considered in the context of TVIX's current assets under management (AUM) of $1.12 billion -- revealing that fund flows activity into TVIX this year has been akin to trying to fill a sieve with water.

VXX investors, for their part, are leaning more toward the "sheer capital incineration" end of the spectrum. Net inflows arrive at $1.04 billion year-to-date, compared to AUM of $847.56 million.

As further context to this raving enthusiasm for money-losing volatility derivatives, it's worth pointing out that the Commitments of Traders (CoT) report shows that large speculators appear to be once again en route to amassing a climactic net short position on VIX futures, which has generally been a reliable contrarian indicator in the past. But we'd argue that the unrelenting inflows into vehicles like TVIX and VXX shows that there are still plenty of investors bracing for a "black swan"-style blow-up, even as stocks edge into new-high territory.

tvix stock chart 1025


Subscribers to Bernie Schaeffer's Chart of the Week received this commentary on Sunday, October 27.

Published on Dec 3, 2019 at 7:51 AM
Updated on Mar 19, 2021 at 7:15 AM
  • VIX and Volatility
  • Indexes and ETFs
  • Bernie's Content

The notion of the Cboe Volatility Index (VIX) being "high" or "low" is, as you're likely aware, entirely a matter of context. During calendar years 2010 through 2016, the average daily VIX reading was 17.92 -- not sky-high by any means, but still a figure that would have seemed downright panicky during the year-long bull-market blowout of 2017, when VIX's average daily print checked in at a virtually unflappable 11.09.

Over the last two years, VIX has settled somewhere in between those two checkpoints. The average daily reading in 2018 was 15.96 through the end of November -- a figure that would ultimately nudge higher to 16.64 by year-end, as equity losses accelerated into the close on Christmas Eve. And through the close on Wednesday, Nov. 27, the average daily VIX for 2019 to date was 15.55... more than 32% above 11.75, which is where VIX settled for the session.

As a matter of fact, the three pre-Thanksgiving sessions last week marked a string of fresh year-to-date low closes for VIX -- all occurring below the 12.00 level, meaning the index was down more than 50% on a year-to-date basis. Prior to that daily closing streak, Friday, Nov. 15 was on our radar as only the sixth session in calendar year 2019 that the spot VIX printed below 12 on an intraday basis, with the previous instances clustered in mid-April and late July.

In the current volatility environment, these spot VIX prints below 12 are not what you want to see if you're short the "fear gauge" -- at least, based on the last two data points. The VIX pop in May followed the initial April 12 "spot < 12" date by 21 calendar days; meanwhile, the VIX spike in August took place only eight calendar days after the July 24 sub-12 print.

We already saw VIX moving higher off its extreme lows in Friday's session, although the 7.4% climb back above the 12 level didn't exactly rise to the level of a "volatility explosion." As a point of caution, however, at least one of the ingredients for a further VIX pop is in place, as the weekly Commitments of Traders (CoT) report continues to show large speculators in an extreme net short position on VIX futures -- a condition that preceded prior ramps higher in the volatility index, as this group reached previous net short extremes in late April and late July of this year.

That said, one thing we're not seeing -- at least, not yet -- is the kind of heavy-handed VIX call buying that preceded those two major volatility spikes earlier this year. Per the chart below, the 20-day buy-to-open call/put volume ratio for VIX options peaked at 5.12 just prior to the May pop in the VIX, and jumped as high as 7.39 directly ahead of the August volatility surge. But this ratio has been trending steadily lower in recent months, and was docked at a middling 2.11 ahead of the Thanksgiving holiday.

While the recent string of sub-12 VIX closes is cause to proceed with caution, remember that when it comes to the VIX, context is everything. If the spot reading remains low and large speculators remain steadfast in their extreme net short position, a rise in call buying may be the final "ingredient" needed to trigger a VIX "melt-up." With that said, there's also the possibility for a less-explosive, gradual resolution with "the VIX continuing to work higher amid little to no damage in the equity market," as Schaeffer's Senior V.P. of Research Todd Salamone recently described it -- all the more reason to keep a watchful eye on sentiment cues as the VIX moves off this key year-to-date floor.

vix call-put ratio 1129

Subscribers to Bernie Schaeffer's Chart of the Week received this commentary on Sunday, December 1.

Published on Jan 27, 2020 at 2:47 PM
Updated on Mar 19, 2021 at 7:15 AM
  • VIX and Volatility
  • Quantitative Analysis
  • Indexes and ETFs

Worries of a coronavirus outbreak have sparked panic selling on Wall Street today, with the major stock indexes all staring at intraday losses of 1% or more. This fear is being seen in the Cboe Volatility Index (VIX), too, which earlier spiked to levels not seen since October -- and sounded a signal seen just 10 other times in the last 16 years.

Specifically, VIX opened today at 17.42, 19.6% above Friday's close at 14.56. While Monday morning gaps of 10%-15% are quite common -- occurring 41 times since September 2003, there have been just 10 occurrences over this time frame where VIX gapped 15% or more on a Monday morning, according to data from Schaeffer's Senior Quantitative Analyst Rocky White. 

Looking at the data, VIX tends to run out of steam following this initial pop, averaging a post-signal open-to-close decline of 0.5%. At last check, the index was up 17.5% at 17.11, and earlier topped out at 19.02.

Measuring from its Monday morning open to the next day's close, the market's "fear gauge" has averaged a 5.54% drop following the past 10 occurrences. This is much larger than the 1.2% "after any Monday" retreat averaged over the past 16 years. 

vix monday returns jan 27

As Schaeffer's Senior V.P. of Research Todd Salamone has indicated, the stock market was already at risk of a major volatility pop this week. And in today's Monday Morning Outlook, Salamone said he still thinks "it is a good idea to use volatility instruments as a hedge if you are heavily tilted toward riding the momentum higher that began in October. And if you view Friday’s pullback as an opportunity to leg into equities that you expect to move higher, utilize call options in lieu of stocks as a risk-management tool."
Published on Apr 27, 2015 at 10:44 AM
Updated on Mar 19, 2021 at 7:15 AM
  • VIX and Volatility
It's VIX-Giving in April! Yes, the last time CBOE Volatility Index (VIX) closed this low was way back on Nov. 26, 2014, the day before Thanksgiving. And that VIX reading requires a bit of an asterisk, as we had more mundane things like "turkey" and "paying five days' worth of options decay" on our minds. So before that, we need to go all the way back to Sept. 19 to see VIX this low.

The folks on the TV seem a bit perplexed as to why we're seeing VIX here now, with all the uncertainty and "blah blah blah." But, if not cheap VIX now, then when?

There's always uncertainty. We never actually get an all-clear bell. And right here, right now, we're in low-vol grind-up mode.

A good portion of earnings season is behind us -- though we still have the Apple Inc. (NASDAQ:AAPL) kahuna. SPDR S&P 500 ETF Trust (SPY) is near all-time highs, and 10-day realized vol in SPY is steady at about a 9. I'm not sure where VIX is "supposed" to sit now, but it sure feels about right.

And, as always, I'm not saying VIX won't lift from here. In fact, I will go on record as saying it will lift from here … probably not tomorrow, but at some point in the next month or three.

Remember all those overbought VIXes from the last half of 2014? It's a distant memory now.

The last time VIX closed 20% or more above its 10-day simple moving average was early January. We haven't had a streak of VIX non-panic this long since … this time last year. We went from January to July, a week short of six months. And then we had five distinct overbought VIX incidents in the ensuing six months, leading me to think we were perhaps morphing into a higher-VIX regime.

With the benefit of hindsight … not so much. At least, not yet. Mean VIX in 2015 sits at 15.94 now. That's up from 14.17 in 2014, but it's clearly in drift mode as we sit and stare at 2015 lows.

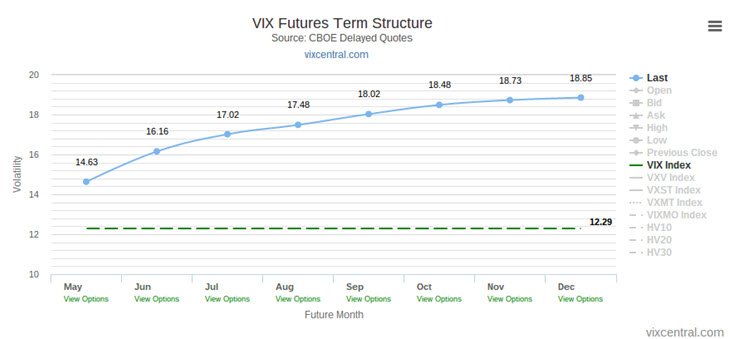
Before you go trying to "bottom" VIX, remember: You're still not buying VIX at these levels. Here's the VIX term structure (click to enlarge):
150427agw

You can't even buy May VIX anywhere near the low 12s. And that only gives you a few weeks' time.

Want to play for a rerun of 2014 and a July vol spike? It sounds like a reasonable idea -- problem is, you need to pay 17 for the July VIX future.

You can, of course, just buy options with nearer-cycle expiration, and pay a lower implied vol than that. But then you're betting on a lift in realized vol more than anything else.

It might happen, of course. But you're risking that time decay will supersede your ability to flip stocks or ETFs or futures well enough to offset the decay.

The best idea to capitalize on low vol is probably just to use it to lock in some gains … or at least insure the gains. Switch stock to calls, e.g., so as to limit the downside. I like it for that, I don't like it for pure speculation on a vol lift -- just feels like there's a particular reason volatility ramps up tomorrow, and if it takes too long, it's a bad idea.

Disclaimer: Mr. Warner's opinions expressed above do not necessarily represent the views of Schaeffer's Investment Research.
Published on Apr 28, 2015 at 8:03 AM
Updated on Mar 19, 2021 at 7:15 AM
  • VIX and Volatility

Is tech in a 1999-esque bubble? With the Nazz hitting new highs, I'm contractually obligated to ask that question. If I had a TV show, I would have to have two guests on. One would say, "Yes, of course we are in a bubble, sell everything before it's too late." The other would say, "No. Unlike 1999, multiples are not extended, especially for mature companies."

And we would accomplish nothing. And, in all fairness, "bubble" is such an amorphous concept. And it's really not helpful to investors. If something is officially declared a bubble, should you run and hide from it? Lots of traders embrace it and try to ride the momentum. Yes, it implies you should play a bit of defense, shorten your holding periods, et al. But maybe those don't represent bad ideas, no matter what's going on. Besides, calling tops and pauses isn't all that simple:

Count me in the "no bubble" camp. That's not because I think stocks are cheap or unfat or whatever, just that I think it's a silly topic.

I will say this, though -- we may have a similarity to 1999 in the options space. Way back when, we saw stock volatility lift alongside market volatility. You even saw negative skew on options boards. That is, higher strikes carried higher implied volatility.

We don't have skew issues now, but we do have a high-profile stock volatility surge. Apple Inc. (NASDAQ:AAPL)!

Granted, it was a pre-earnings volatility pop. But, it was more than just anticipation of the numbers. This, from Bloomberg:

A Chicago Board Options Exchange volatility gauge for Apple shares has jumped 42 percent since a low in March, while a measure of Nasdaq 100 swings has fallen 2.3 percent. The Apple VIX closed at 2.4 times the level of the Nasdaq 100 VIX last week, the highest ratio between the two since October 2013.

The market priced in about a 5.5% move on earnings … and their announcement of cash-allocation plans. That was pretty average for AAPL, and suggests the implied vol lift may persist, assuming a bit of give-back this morning.

And, we can make the case that AAPL IS the economy and IS the market these days. An actual volatility lift here is literally a self-fulfilling prophecy for a lift in market volatility. Can it keep up the volatility after today? We'll see. So, volatility bulls, you have that going for you, which is nice!

Disclaimer: Mr. Warner's opinions expressed above do not necessarily represent the views of Schaeffer's Investment Research.
Published on Apr 29, 2015 at 8:54 AM
Updated on Mar 19, 2021 at 7:15 AM
  • VIX and Volatility

In my never-ending (futile) quest to improve the volatility education we get on the TeeVee, I bring you this from the other day:

"Typically, you get a lot of volatility in the market as earnings get reported."

That sounds intuitive, right? But, it contains no real basis in fact.

I may mention from time to time that I wrote an options book. OK, if I haven't mentioned it, I had a book published in 2009.

Anyway, I bring this up for self-promotion … I mean, for the purpose of mentioning some numbers I ran way back then. If we really do get a lot of volatility around earnings, it should reflect that in elevated CBOE Volatility Index (VIX) readings during earnings season. The bulk of earnings come out in the back end of January, April, July, and October. So, all other things being equal, we should see increased VIX in the second half of those four months.

Well, as luck would have it, I did a study where I looked at VIX in the front- and back-end of each monthly cycle. In my numbers, "first-half January" is actually late December on the calendar.

So, if we did indeed see "a lot of volatility in the market as earnings get reported," my numbers would show elevated volatility in the first halves of February, May, August, and November.

Did we? Well, here are the rankings by first-half median VIX:

  • December 20.09
  • March 18.62
  • February 18.47
  • September 18.02
  • April 17.79
  • August 17.75
  • November 17.03
  • June 17.03
  • January 16.94
  • May 16.82
  • October 16.66
  • July 16.18

If volatility did indeed pick up much during earnings season, I would have expected those cycles highlighted in bold to sit closer to the top of the list. Yet as of 2009, they ranked 3rd, 6th, 7th, and 10th. That's about as random as possible, and suggests to me there's no actual global volatility spike around earnings.

And perhaps the vol-spike notion isn't even as intuitive as meets the eye. Yes, individual stocks can make big and volatile earnings moves. But, in order to see a global volatility move, we'd need all those earnings moves to go in the same direction. And that's very unlikely. Markets adjust quickly. If we start out with some disappointments, we tend to lower the bar going forward, and then get relief rallies. Or, vice versa. Throw it all together, and the market itself doesn't tend to see unusually large earnings-related moves.

Disclaimer: Mr. Warner's opinions expressed above do not necessarily represent the views of Schaeffer's Investment Research.

Begin the New Year With Schaeffer's 7 FREE 2022 Stock Picks!

1640638248


MORE | MARKETstories


Which Telehealth Stock Should You Be Targeting?
Telehealth stocks HIMS, DOCS, and TDOC are a volatile bunch today
J.P. Morgan Downgrade Stings Bumble Stock
The analysts in coverage downgraded BMBL to "underweight" from "neutral"