Earnings Season Highlights

Refresh your browser for the latest updates!
A collection of noteworthy post-earnings reactions
Published on Apr 6, 2021 at 9:35 AM
  • Buzz Stocks

The shares of Snap Inc (NYSE:SNAP) are up 4.5% at $56.52 this morning, buzzing on analyst praise. Specifically, Atlantic Equities lifted its rating to "overweight" from "neutral," citing strength in its ad business and pipeline products, which could help grow revenue.

Atlantic Equities joins an already bullish brokerage bunch. Prior to today's coverage, 21 analysts considered SNAP a "buy" or better, while six said "hold" or worse. Plus, the 12-month consensus price target of $74.03 stands at a 36.8% premium to current levels.

The security seems to be bouncing back from the selloff it suffered from late-February through March, with support at the 120-day moving average providing a springboard late last month. The stock will still have to contend with pressure at the 20-day moving average, though, which has acted as a ceiling on the charts for nearly three weeks. Year-over-year, SNAP is up 345%.

Premiums on SNAP are still relatively inexpensive, as the equity's Schaeffer's Volatility Index (SVI) of 60% sits in the 22nd percentile of its annual range, implying option traders are pricing in relatively low volatility expectations at the moment. 

Plus, the security's Schaeffer's Volatility Scorecard (SVS) sits at a high 92 out of 100. This means SNAP has exceeded volatility expectations during the past 12 months -- a boon for options buyers.

Published on Apr 6, 2021 at 8:13 AM
  • Buzz Stocks

Today's Stock Market News & Events: 4/6/2021

by Schaeffer's Digital Content Team

The latest job openings numbers are due out today. There will also be a handful of interesting earnings reports due out today.

The following company is slated to release its quarterly earnings report today, April 6:

The Greenbrier Co. Inc. (NYSE:GBX -- $48.25) designs, manufactures, and markets railroad freight car equipment. Greenbrier will report its Q2 earnings of 2021 before the bell today.

Lindsay Corp. (NYSE:LNN -- $169.17) provides water management and road infrastructure products and services. Lindsay will report its Q2 earnings of 2021 before the bell today.

Paychex Inc. (NASDAQ:PAYX -- $100.36) provides integrated human capital management solutions for human resources (HR), payroll, benefits, and insurance services. Paychex will report its Q3 earnings of 2021 before the bell today.

SMART Global Holdings Inc. (NASDAQ:SGH -- $49.48) designs and manufactures electronic products focused in memory and computing technology areas. SMART Global will report its Q2 earnings of 2021 after the close today.

Looking ahead to tomorrow, Wall Street will keep an eye on February's trade deficit data, as well as consumer credit  data. The FOMC meeting minutes will also be released on Wednesday afternoon. All economic dates listed here are tentative and subject to change.

Published on Apr 5, 2021 at 3:10 PM
  • Most Active Options Update
Today, NVDA is seeing a similar preference for calls. So far, 73,000 calls and 37,000 puts have crossed the tape. 
Published on Apr 5, 2021 at 3:06 PM
  • Earnings Preview

Snack Stock on the Mend Headed into Earnings

by Schaeffer's Digital Content Team
 
Published on Apr 5, 2021 at 2:49 PM
  • Quantitative Analysis

Riot Blockchain Inc (NASDAQ:RIOT) is on fire this afternoon, the equity has added 9% to trade at $56.79 so far today, extending it's impressive March climb, in which it added 21.8% for the month. The security is still a ways from its Feb. 17, 10-year peak of $79.50, with pressure near the $65 mark keeping a lid on shares last month. There's reason to believe, though, that RIOT could extend today's positive price action, making the security a solid growth pick for April. 

According to data from Schaeffer's Senior Quantitative Analyst Rocky White, the crypto stock just pulled back to its 40-day moving average after a lengthy period above the trendline. Similar pullbacks to this trendline have occurred five times over the past three years. One month after 75% of these signals, RIOT was higher, going on to average an impressive 21-day return of 52.5%. Needless to say, a similar return would put the equity well past its February peak, all the way above the $86 mark, which is home to levels RIOT hasn't touched since 2011. 

RIOT Aprl 5

RIOT's recent bounce could have shorts changing their tune, too, and an exodus of these bears could put even more wind at the stock's back. Short interest rose 24.6% in the last two reporting periods, and now makes up an eyebrow-raising 59.7% of the equity's available float. 

Some of the bearishness in the options pits could unwind and push RIOT higher as well. At the Securities Exchange (ISE), Cboe Options Exchange (CBOE), and NASDAQ OMX PHLX (PHLX), Riot Blockchain stock sports a 50-day put/call volume ratio that sits higher than 74% of readings from the past year. 

In this same vein, options look like the way to go. The stock's Schaeffer's Volatility Index (SVI) of 123% sits in the 8th percentile of its annual range, meaning option traders have rarely priced in lower volatility expectations during the past year. Plus, RIOT's Schaeffer's Volatility Scorecard (SVS) ranks at a 99 out of a possible 100, implying the stock has tended to exceed these expectations over the past 12 months -- a good thing for option buyers. 

Published on Apr 5, 2021 at 10:49 AM
  • Buzz Stocks

The shares of Tesla Inc (NASDAQ:TSLA) are surging this morning, up 4.5% at $691.68 at last check, after the electric vehicle giant hit a delivery record of 184,800 units for the first quarter -- well above Wall Street's estimates of 177,822 deliveries. The tech name attributed the milestone to strong demand, which helped offset the impact of a global shortage of auto parts. 

Additionally, Wedbush upgraded the security to "outperform" from "neutral," and raised its price objective to $1,000 from $950. Cowen and Company and JP Morgan Securities followed suit, doling out price-target hikes to $573 and $155, respectively. Analysts were pessimistic towards the security coming into today, leaving the door open for more price-target hikes and/or upgrades going forward. Of the 20 in question, 12 called it a "hold" or worse. Plus, the 12-month consensus target price of $621.60 is a hefty 10.3% discount to current levels. 

Digging deeper, the security has taken a major step back from its Jan. 25, all-time high of $900.40. Shares have struggled with overhead pressure at the $720 level in the last month, though the 160-day moving average was able to contain two March pullbacks. Today's pop has also helped the security rise back above the 20-day moving average, and year-over-year TSLA is up 622.5%.

Though shorts are already hitting the exits, there is plenty of pessimism left to be unwound, which could push shares even higher. Short interest fell 6.2% in the last two reporting periods, yet the 44.73 million shares sold short account for 25% of the stock's available float.

Additional tailwinds could come in the from of a shift in the options pits. This is per Tesla stock's 50-day put/call volume ratio at the International Securities Exchange (ISE), Cboe Options Exchange (CBOE), and NASDAQ OMX PHLX (PHLX), which stands in the 84th percentile of its annual range. In other words, long puts are getting picked up at a faster-than-usual rate. 

What's more, TSLA options can be had at a discount at the moment. The equity's Schaeffer's Volatility Index (SVI) of 57% sits at the low 8th percentile of its annual range. This suggests the equity is sporting attractively priced premiums right now.

Lastly, the security's Schaeffer's Volatility Scorecard (SVS) ranks at a high 95 out of 100. This means Tesla stock has exceeded volatility expectations during the past year -- a good thing for premium buyers.

Published on Apr 1, 2021 at 10:25 AM
Updated on Apr 5, 2021 at 10:37 AM
  • Buzz Stocks
 
Published on Apr 5, 2021 at 10:31 AM
  • Buzz Stocks

VBTX Maintains Growth Despite Board Member Exit

by Schaeffer's Digital Content Team
 
Published on Apr 5, 2021 at 10:15 AM
  • Buzz Stocks

The shares of Pinterest Inc (NYSE:PINS) are up 1.6% at $78.94 this morning, following news that the social media platform is in talks to acquire popular photo app VSCO, according to the New York Times. While a potential price is still off the table, VSCO was last valued at $550 million, and has 100 million registered users, which includes over 2,000 paying subscribers. 

PINS looks to be staging a strong bounce off its early March breather, with today's pop adding to these gains. In fact, last week PINS surged past its 20-day moving average, which applied solid pressure to the stock for most of last month, while a ceiling at the 50-day moving average was also toppled last Thursday. The equity is trading at its highest level in over a month today, and is up roughly 18% this year. 

The majority of analysts covering PINS are optimistic on the equity, though it could benefit from additional upgrades. Of the 19 in coverage, six still consider the security a "hold," while the remainder say "buy" or  better. The 12-month consensus price target of $89.29, meanwhile, is an 11.9% premium to current levels, and sits directly below the equity's record high of $89.90. 

Now looks like an ideal time to speculate on Pinterest's next move with options. The stock's Schaeffer's Volatility Index (SVI) of 51% stands higher than all other readings from the past year, meaning option traders haven't priced in lower volatility expectations for PINS in the past 12 months. On top of this, its Schaeffer's Volatility Scorecard (SVS) ranks at 83 out of a possible 100. This implies the equity has tended to exceed these volatility expectations during this one-year time frame -- a boon for options buyers. 

Published on Apr 5, 2021 at 9:30 AM
  • Analyst Update
 
Published on Apr 5, 2021 at 9:25 AM
  • Buzz Stocks

The shares of Planet Fitness Inc (NYSE:PLNT) are up 1.6% at $78.52 before the bell, after the company announced plans to open more locations in the coming fiscal year. Specifically, the fitness chain plans to open 100 new exercise centers, adding to its portfolio of more than 2,100 locations. In other news, CFO Tom Fitzgerald, in an interview with the Wall Street Journal, said the company wants to invest more in its mobile app. 

Things were looking good for Planet Fitness stock to kick off 2021. The equity quickly rose to notch a new all-time high of $90.34 by Feb. 25. However, PLNT has struggled on the charts since then, with the security's 80-day moving average now moving in as a level of resistance. Still, year-over-year, the stock is up 85.5%.

The options pits have been extremely optimistic over the last 10 weeks. This is per the equity's 50-day call/put volume ratio of 1.42 at the International Securities Exchange (ISE), Cboe Options Exchange (CBOE), and NASDAQ OMX PHLX (PHLX). This ratio stands higher than 85% of readings from the past year, suggesting calls are being picked up at a quicker-than-usual clip of late. 

Now looks like a great opportunity to bet on PLNT's next move with options, too. The security's Schaeffer's Volatility Index (SVI) of 38% stands in the lowest percentile of its annual range. In simper terms, this suggests the equity is sporting attractively priced premiums at the moment.

Published on Apr 5, 2021 at 8:55 AM
  • Monday Morning Outlook

As we leave the Ides of March, and possibly the choppy market action behind, we enter a particularly bullish period for equities. Notably, March OPEX has created volatility ahead of quarterly fund rebalancing before we often see a swift seasonal move to the upside. I highlighted this on Twitter this past week as I believed “The March Dip Before the April Rip” was right on track. Over the past 10 years the S&P 500 Index (SPX – 4,019.87)  has been positive by +2.47% in the month of April, the past 20-years it’s been positive by +2.07%, and over the past 50 years it’s been positive to the tune of +1.39%. Additionally, when it is a newly elected president's first year of their respective first term, it has been positive by +1.11%, going back to the Ronald Reagan administration.  


So, I suspect that we were working through at the very least a short-term constructive pullback, as we’ve seen many of the momentum names that propelled indices higher earlier this year pull back between 40% - 60% or more over the past few weeks. Furthermore, the S&P 500 SPDR ETF Trust (SPY – 400.61) has room up to the large open-interest call strike at 410 for April expiration, which could be an area in which we finally find some resistance later in the month. Therefore, where are we looking for alpha? 

SPY OI

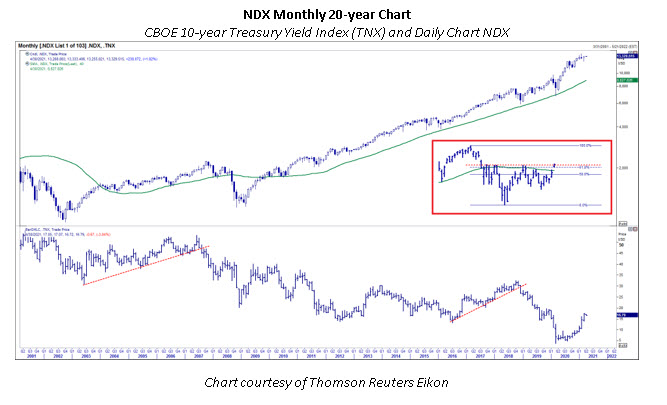
If you are looking for technical permission to enter a bullish, large-cap technology trade, which is advised, I think it is best if you look for resistance that I discussed last week to get taken out. Specifically, and per the chart below, look for the NDX to climb back above a combination of its 40-day moving average, which marked last week’s peak. Plus, the 13,000 level and 13,037, which is a 50% Fibonacci retracement of the recent closing high and low, remain significant.

- Monday Morning Outlook, March 22, 2021

The past few weeks, we’ve highlighted where you can possibly find favorable equity allocations, as we noted the pullback in both the Russell 2000 Index (RUT – 2,253.92) and Nasdaq 100 Index (NDX -13,329.52) were moving into key levels. First, the RUT pulled back 10% from its highs and roughly into the +10% YTD level where it has consistently found support throughout March and closed above the 20-day moving average to end the holiday-shortened week last Thursday. Secondly, the NDX had been pulling back only to regain the YTD breakeven level, which has held over the past three weeks. Still, Thursday’s push higher broke above technical resistance, permitting us to get long once again as it broke above its 40-day moving average. In addition, this solidified the breakout above the round 13,000 level, and the index broke above both the 50% and 61.8% Fibonacci retracement levels. 

NDX Monthly


Moreover, pundits have made a bunch of noise about how interest rates have been hindering technology stocks lately. Now this is partially true, since when rates rise rapidly, technology stocks usually stall at least in the short-term. Nevertheless, these rapid rate rises typically level off relatively quickly, and any consolidation in rates, even if it’s just sideways action, have been signals for technology to resume its longer-term trend. Furthermore, we have also experienced two significant periods where we have had a rising rate environment, as evidenced by the CBOE U.S. 10-year Treasury Index (TNX – 17.27), while technology also moved higher, which happened from 2003 to 2007 and from mid-2016 to 2018. 

SPX Growth Value

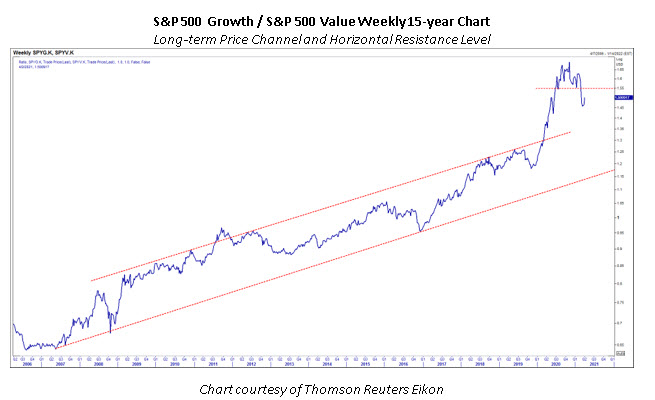
To pull this together, we should look at value versus growth through its relative ratio chart. Value trades in the past have been short-lived, and growth has typically taken over. This could still be true, but it is evident that the growth trend has broken down, at least in the intermediate term, when looking at the chart. I suspect that we’ll continue to see a minor growth retrace back to the breakdown level over the next month into resistance. What I take away from this is we can likely allocate to both value and growth trades, but in different time intervals. Growth trades should be taken on a shorter-term timeframe, but we can still allocate to value ideas as they pull back and set up for another likely move higher, as our economy continues to reopen.  

…for VIX futures options expiring in April, May, and June, that beginning in late-February, put open interest exceeded call open interest. Such situations are rare. But historical occurrences in the past have preceded a declining VIX. This time around, VIX put open interest gained traction, versus call open interest, when the VIX was making its most recent peak around its 252-day moving average.
The current open interest configuration on VIX futures could be hinting that the VIX is poised to break below the 19-20 floor in the weeks or months ahead.

- Monday Morning Outlook, March 8, 2021

Additionally, we saw the CBOE Volatility Index (VIX--17.53) finally break below the 19-20 floor we discussed a couple of weeks ago. This happened much quicker than we expected, but it continues to support a bullish thesis as we attempt to move into a lower volatility environment, which is supportive of stocks in general. 

SPX 5 Year

Furthermore, the SPX/VIX 3-month correlation has significantly fallen. Yet another indication that we could be re-entering a lower volatility environment, as this indicator has a fairly consistent ability to predict volatility and subsequent rallies in equities following a rollover. When thinking about the VIX leaving the high volatility environment, one caveat comes to mind. In the past, when we have been in extended high volatility environments such as the tech bubble, the 2008 financial crisis, and now the past year, we need to watch out for a false breakdown. While having only two previous samples doesn’t provide statistical significance, both found lows around the 17 area before exploding higher once again and catching equity buyers off guard. So, we will want to keep this kernel of information in the back of our heads to adjust and act accordingly if past patterns reemerge.
NAAIM Exposure

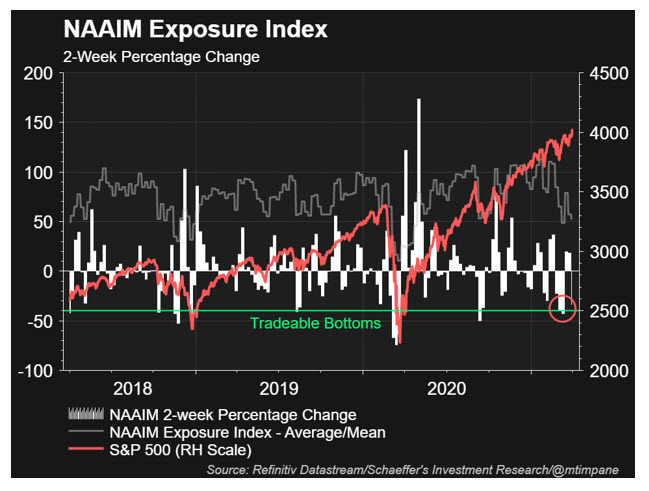
March certainly helped reset the euphoric bullish sentiment that plagued us to start the year. A couple of weeks ago on Twitter, I alluded to how we can use the percent change in the NAAIM Exposure Index to look for short-term equity bottoms. Specifically, I look for a -40%, 2-week change in the index to signal that we should be looking for a bottom in stocks within the next four weeks. While it is not the most specific timing tool, it does give us an idea of when we should be looking out for capitulation bottoms in stocks. 

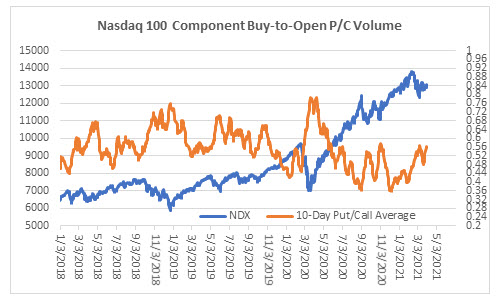
The family office, Archegos Capital, which was leveraged five-to-one on its holdings, blew up early last week. In turn, this caused the prime brokers that the fund cleared through to rapidly liquidate $80 billion worth of holdings, causing a small panic in the markets. This very well might have given us that extreme capitulation bottom, as many securities were dramatically lower and quite possibly setting us up for an environment where we can resume higher in equity indexes. Moreover, the NDX 10-day buy-to-open put/call ratio is at 0.56, which is back near an area where we’ve seen the NDX rally and supports our technical permission thesis that we can be long large-cap technology once again. 
NDX 10day pc

As we’ve stated in previous weeks, we still think positioning towards small-caps is the way to go, but we are also seeing bullish potential in beaten-down technology names in the near term as we enter the seasonally bullish month of April. 

Senior Market Strategist Matthew Timpane

Continue reading:

Begin the New Year With Schaeffer's 7 FREE 2022 Stock Picks!

1640638248


MORE | MARKETstories


MongoDB Stock Soars After Beat-and-Raise
MongoDB announced better-than-expected first-quarter results
Luxury Retail Stock Sinks on Dismal Revenue Outlook
PVH is down 36% in 2025, and is a downgrade risk going forward