As we leave the Ides of March, and possibly the choppy market action behind, we enter a particularly bullish period for equities. Notably, March OPEX has created volatility ahead of quarterly fund rebalancing before we often see a swift seasonal move to the upside. I highlighted this on Twitter this past week as I believed “The March Dip Before the April Rip” was right on track. Over the past 10 years the S&P 500 Index (SPX – 4,019.87) has been positive by +2.47% in the month of April, the past 20-years it’s been positive by +2.07%, and over the past 50 years it’s been positive to the tune of +1.39%. Additionally, when it is a newly elected president's first year of their respective first term, it has been positive by +1.11%, going back to the Ronald Reagan administration.
So, I suspect that we were working through at the very least a short-term constructive pullback, as we’ve seen many of the momentum names that propelled indices higher earlier this year pull back between 40% - 60% or more over the past few weeks. Furthermore, the S&P 500 SPDR ETF Trust (SPY – 400.61) has room up to the large open-interest call strike at 410 for April expiration, which could be an area in which we finally find some resistance later in the month. Therefore, where are we looking for alpha?

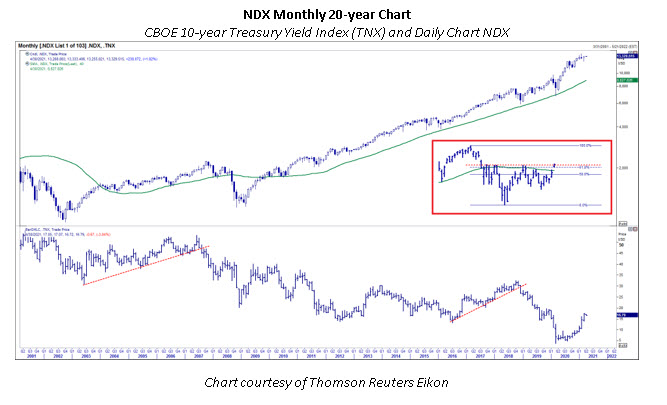
If you are looking for technical permission to enter a bullish, large-cap technology trade, which is advised, I think it is best if you look for resistance that I discussed last week to get taken out. Specifically, and per the chart below, look for the NDX to climb back above a combination of its 40-day moving average, which marked last week’s peak. Plus, the 13,000 level and 13,037, which is a 50% Fibonacci retracement of the recent closing high and low, remain significant.
- Monday Morning Outlook, March 22, 2021
The past few weeks, we’ve highlighted where you can possibly find favorable equity allocations, as we noted the pullback in both the Russell 2000 Index (RUT – 2,253.92) and Nasdaq 100 Index (NDX -13,329.52) were moving into key levels. First, the RUT pulled back 10% from its highs and roughly into the +10% YTD level where it has consistently found support throughout March and closed above the 20-day moving average to end the holiday-shortened week last Thursday. Secondly, the NDX had been pulling back only to regain the YTD breakeven level, which has held over the past three weeks. Still, Thursday’s push higher broke above technical resistance, permitting us to get long once again as it broke above its 40-day moving average. In addition, this solidified the breakout above the round 13,000 level, and the index broke above both the 50% and 61.8% Fibonacci retracement levels.

Moreover, pundits have made a bunch of noise about how interest rates have been hindering technology stocks lately. Now this is partially true, since when rates rise rapidly, technology stocks usually stall at least in the short-term. Nevertheless, these rapid rate rises typically level off relatively quickly, and any consolidation in rates, even if it’s just sideways action, have been signals for technology to resume its longer-term trend. Furthermore, we have also experienced two significant periods where we have had a rising rate environment, as evidenced by the CBOE U.S. 10-year Treasury Index (TNX – 17.27), while technology also moved higher, which happened from 2003 to 2007 and from mid-2016 to 2018.

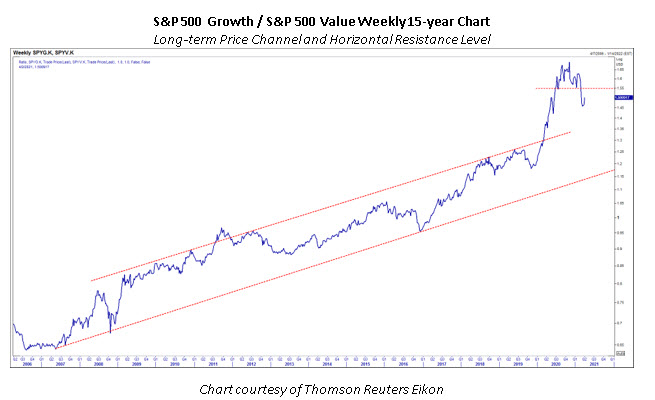
To pull this together, we should look at value versus growth through its relative ratio chart. Value trades in the past have been short-lived, and growth has typically taken over. This could still be true, but it is evident that the growth trend has broken down, at least in the intermediate term, when looking at the chart. I suspect that we’ll continue to see a minor growth retrace back to the breakdown level over the next month into resistance. What I take away from this is we can likely allocate to both value and growth trades, but in different time intervals. Growth trades should be taken on a shorter-term timeframe, but we can still allocate to value ideas as they pull back and set up for another likely move higher, as our economy continues to reopen.
…for VIX futures options expiring in April, May, and June, that beginning in late-February, put open interest exceeded call open interest. Such situations are rare. But historical occurrences in the past have preceded a declining VIX. This time around, VIX put open interest gained traction, versus call open interest, when the VIX was making its most recent peak around its 252-day moving average.
The current open interest configuration on VIX futures could be hinting that the VIX is poised to break below the 19-20 floor in the weeks or months ahead.
- Monday Morning Outlook, March 8, 2021
Additionally, we saw the CBOE Volatility Index (VIX--17.53) finally break below the 19-20 floor we discussed a couple of weeks ago. This happened much quicker than we expected, but it continues to support a bullish thesis as we attempt to move into a lower volatility environment, which is supportive of stocks in general.

Furthermore, the SPX/VIX 3-month correlation has significantly fallen. Yet another indication that we could be re-entering a lower volatility environment, as this indicator has a fairly consistent ability to predict volatility and subsequent rallies in equities following a rollover. When thinking about the VIX leaving the high volatility environment, one caveat comes to mind. In the past, when we have been in extended high volatility environments such as the tech bubble, the 2008 financial crisis, and now the past year, we need to watch out for a false breakdown. While having only two previous samples doesn’t provide statistical significance, both found lows around the 17 area before exploding higher once again and catching equity buyers off guard. So, we will want to keep this kernel of information in the back of our heads to adjust and act accordingly if past patterns reemerge.

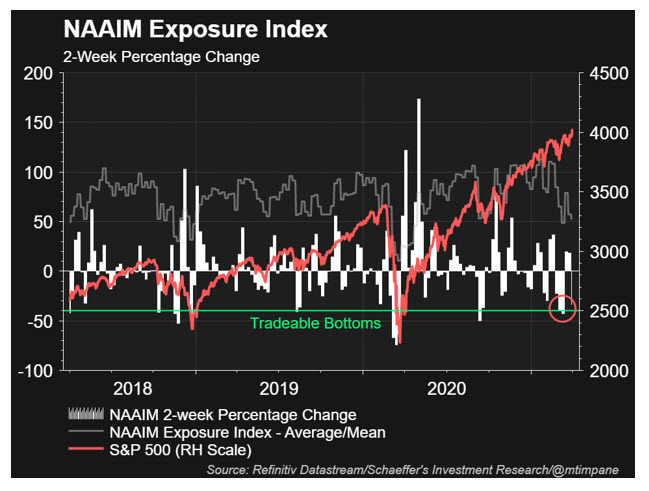
March certainly helped reset the euphoric bullish sentiment that plagued us to start the year. A couple of weeks ago on Twitter, I alluded to how we can use the percent change in the NAAIM Exposure Index to look for short-term equity bottoms. Specifically, I look for a -40%, 2-week change in the index to signal that we should be looking for a bottom in stocks within the next four weeks. While it is not the most specific timing tool, it does give us an idea of when we should be looking out for capitulation bottoms in stocks.
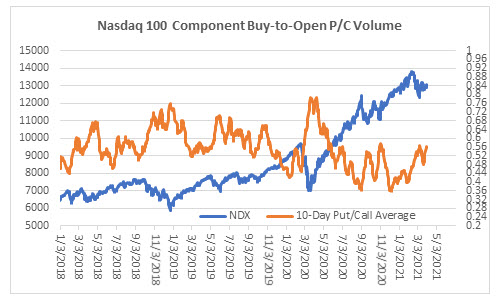
The family office, Archegos Capital, which was leveraged five-to-one on its holdings, blew up early last week. In turn, this caused the prime brokers that the fund cleared through to rapidly liquidate $80 billion worth of holdings, causing a small panic in the markets. This very well might have given us that extreme capitulation bottom, as many securities were dramatically lower and quite possibly setting us up for an environment where we can resume higher in equity indexes. Moreover, the NDX 10-day buy-to-open put/call ratio is at 0.56, which is back near an area where we’ve seen the NDX rally and supports our technical permission thesis that we can be long large-cap technology once again.

As we’ve stated in previous weeks, we still think positioning towards small-caps is the way to go, but we are also seeing bullish potential in beaten-down technology names in the near term as we enter the seasonally bullish month of April.
Senior Market Strategist Matthew Timpane
Continue reading: