From a short-term perspective, we are now past one of the more lucrative time periods for bulls during the rate-tightening cycle that began in December 2015. Prior to Aug. 1, in instances when the Fed did not tighten at a scheduled Federal Open Market Committee (FOMC) meeting and a retail survey showed pessimism ahead of the inaction, the SPDR S&P 500 ETF Trust (SPY - 287.60) had an 83% chance of advancing in the following month, or 20 trading days, with an average gain of 2.4%.
On Aug. 1, the Fed did not raise rates coincident with a sentiment survey showing pessimism among retail investors. Exactly 20 days later, on Aug. 29, the SPY closed at its most recent all-time closing high, 3.8% above its Aug. 1 close -- rallying as expected, but also rallying significantly more than expected.
"BlackRock's Fink Sees U.S. Slowdown, 10-15% Market Drop in Tariff War"
-- Bloomberg, July 16, 2018
"Stocks vulnerable to 5-10 percent pullback, Invesco's top market watcher warns"
-- CNBC, September 4, 2018
"Goldman Sachs Joins Citigroup in Flashing Warnings on S&P 500"
-- Bloomberg, September 5, 2018
"UBS Sees S&P 500 Dropping 5% Should Trump Levy 25% China Tariffs"
-- Bloomberg, September 6, 2018
"Markets dropping in recent trade; President Trump speaking to reporters says that that another tranche of $267 bln in China tariffs are ready to go following the $200 bln China tariff tranche"
"President Trump speaking to reporters on Air Force One says that trade talks with Canada are moving along pretty well and he is working on trade deal with Japan"
-- Briefing.com midday headlines, September 7
Now, we are less than three weeks away from the next scheduled FOMC meeting, on Sept. 26. And last week, we saw sellers take away some of the gains that were beyond what was expected one month after the Fed paused on rates. Not only is the excitement of the early August Fed pause over, but the height of earnings season is behind us, and market participants are now more likely to trade off macro headlines -- most notably, headlines regarding trade negotiations.
With many strategists sounding the cautionary alarm these past few weeks -- and particularly last week -- the Friday afternoon trade reports unsurprisingly generated a quick sell-off, with the S&P 500 Index (SPX - 2,871.68) losing 15 points, or 0.5%, in the first 30 minutes after the headlines surfaced. But the index immediately steadied around its January 2018 closing high in the 2,870 area.
The sell reaction was not a huge surprise, but the magnitude of the selling may have surprised some, most notably those among the strategist crowd warning of a correction if more tariffs are implemented. Then again, as I have said before, investors in Chinese stocks should worry about negative U.S.-China trade negotiations more so than U.S. investors, judging by the way the Chinese market has performed since early 2018 relative to U.S. stocks. And perhaps the initial reaction of additional China tariffs being readied was muted by follow-up headlines regarding trade negotiations with Japan and Canada, and/or these headlines amounting to nothing more than words (for now).
From a technical perspective I am seeing cross-currents that might suggest range-bound trading into the end of the month. For example, the SPX rallied above the 2,900-century mark in late August, but the breakout was short-lived and a pullback has since pushed the index back below this level. But as I said earlier, the SPX appeared to be finding support around its January 2018 high in the immediate aftermath of Friday's trade headlines, suggesting a bounce could be imminent following the weakness that occurred in the first week of September.
Likewise, the Dow Jones Industrial Average (DJI - 25,916.54) briefly moved back above 26,000 in late August, but has since retreated back below this round-number mark. Moreover, the Nasdaq Composite (IXIC - 7,902.54) experienced a short-lived move through 8,000, only to be turned back below this round-number millennium mark last week. This index is now sitting just above 7,900 -- a century mark that could be supportive, as a trendline connecting the June, July, and August lows is sitting here, too.
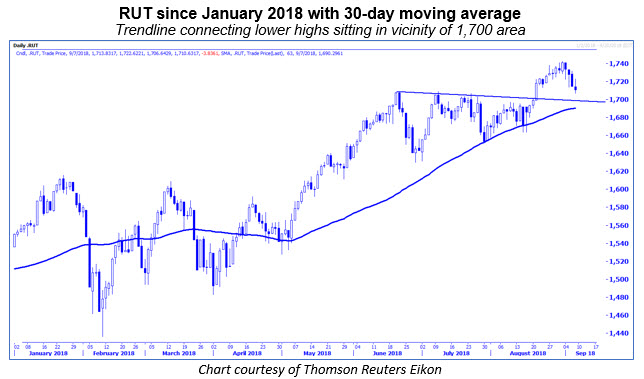
"...after three months of struggling with 1,700 and making a series of lower highs in that time frame, the RUT broke out above a trendline situated 20 points below 1,700, and took out the 1,700 level shortly thereafter. If the price behavior continues to mirror that of the first half of 2018, the RUT rally will continue on into the late-September Federal Open Market Committee (FOMC) meeting... after toying with the 2,000 millennium mark since January, the MID managed to close above this level for seven consecutive days, carving out a new all-time closing high in the process."
-- Monday Morning Outlook, August 27, 2018
As the benchmarks mentioned above were cresting in late August, so too were the S&P MidCap 400 Index (MID - 2,027.25) and Russell 2000 Index (RUT - 1,713.18), which were trading significantly above key round number areas. They, too, have retreated from their late-August highs, but remain above 2,000 and 1,700, respectively. In the absence of significant macro catalysts, I would expect these support levels to hold in the coming days. The MID, for what it's worth, has a similar trendline sitting just above the 2,000 level, which coincidentally is the site of its January high.
I found it interesting that one reason for Citigroup strategists' warning of a correction is that they feel there is too much optimism. Admittedly, surveys are showing optimism creeping into the market, with Investors Intelligence (II) reporting that the number of bullish newsletter advisors is at 60% -- the highest since January. Retail investors have also become more bullish relative to early August, just ahead of the Fed's pause. In early August, the American Association of Individual Investors (AAII) poll showed the bearish percentage outweighing the bullish percentage by 13 points, but in the most current reading, the bullish percentage outweighed the bearish percentage by 16 points.
Potentially neutralizing that optimism is the number of cautionary words from strategists, as I excerpted near the beginning of this commentary. But these increasingly optimistic surveys, along with the bearish positioning on Cboe Volatility Index (VIX - 14.88) futures by large speculators in the weekly Commitments of Traders (CoT) report, remain risks and support Citi's model.
However, other sentiment measures do not suggest danger is imminent. For example, those trading major exchange-traded funds (ETFs) are showing a preference for technology stocks (deservedly so) and underperforming bonds, more so than broader equity funds such as the SPY, which has registered outflows since the beginning of August (per etf.com data). Finally, the equity-only, buy-to-open put/call volume ratio is still not at levels that are shouting caution in the immediate term.


Look for equities to bounce back in the immediate days or weeks ahead and for the pessimism we saw in early August to further unwind. However, the end of September brings us the next FOMC meeting, where the Fed is expected to raise rates again. A combination of growing optimism ahead of a Fed rate hike could set us up for a pullback in October.
Continue reading: