
The RUT seems to be staging a repeat of its January-May price action
"On the heels of a solid earnings season and the Fed holding rates steady earlier this month, I think there is enough buying power to push stocks through resistance before the Fed meets in late September... With the 10-day equity-only, buy-to-open put/call volume ratio rolling over from a relatively high level, this could signal that short-term pessimism is unwinding, which is a welcome ingredient to drive equity benchmarks through the resistance levels discussed above."
-- Monday Morning Outlook, August 20, 2018
In last week's concluding remarks, I focused on the sentiment backdrop (an unwinding of short-term pessimism) being supportive of equities on the heels of the Fed holding rates steady earlier in the month and a blockbuster earnings season. My one concern was from a technical perspective when looking at multiple indexes and exchange-traded funds (ETFs).
Specifically, psychological round-number levels resided just overhead on the Russell 2000 Index (RUT - 1,725.67) and S&P MidCap 400 Index (MID - 2,035.10) at 1,700 and 2,000, respectively. Plus, the S&P 500 Index (SPX - 2,874.69) was trading at 2,850, and half-century marks like this have historically marked pivot and/or hesitation areas.
Moreover, the SPX's January all-time closing high of 2,872.87 was less than 1 percentage point away, potentially setting up a "double-top" formation if the SPX revisited this level. Finally, a heavily traded ETF that represents market-leading technology stocks, the Invesco QQQ Trust (QQQ - 182.48), was struggling to make a sustained move through $180, as those who bought the breakout above its 2000 high of $120 were likely locking in 50% profits.
Despite negative headlines -- ranging from the yield curve hitting its flattest level in year, to President Donald Trump's former attorney entering a plea deal (viewed as a negative for Trump as impeachment odds increased), to low-level trade talks between China and the U.S. not bearing progress -- equities rallied, as the short-term pessimism evident a few weeks ago continued to unwind, albeit slowly.
In fact, after toying with the 2,000 millennium mark since January, the MID managed to close above this level for seven consecutive days, carving out a new all-time closing high in the process.

Similarly, since June, the RUT had not managed two or more consecutive closes above the 1,700 century mark. Last week this changed, as the RUT carved out a new all-time high amid four consecutive closes above 1,700. In fact, the RUT's price behavior looks remarkably like that of January-May 2018, when the index made a series of lower highs for four months before breaking out above a trendline connecting the lower highs 20 points below the 1,600 century mark, which had given it trouble in prior months. The RUT went on to rally strongly for the following six weeks after that breakout.
And now, after three months of struggling with 1,700 and making a series of lower highs in that time frame, the RUT broke out above a trendline situated 20 points below 1,700, and took out the 1,700 level shortly thereafter. If the price behavior continues to mirror that of the first half of 2018, the RUT rally will continue on into the late-September Federal Open Market Committee (FOMC) meeting.

Meanwhile, throughout last week, the SPX flirted with its January closing high, trading above it on Tuesday before closing narrowly above it on Friday -- albeit by less than 2 points, thereby keeping a potential "double top" formation in play. Certainly, some technicians may be positioning for a double-top pattern, and others may be taking a "wait-and-see" approach before committing new money to larger-cap equities. Will such behavior stop the SPX rally in its tracks, and for how long? This is a possibility, but at the same time such caution represents future buying power. Therefore, it is worthwhile to bet on a breakout to the upside, anticipating the SPX to follow in the path of small- and mid-cap stocks.
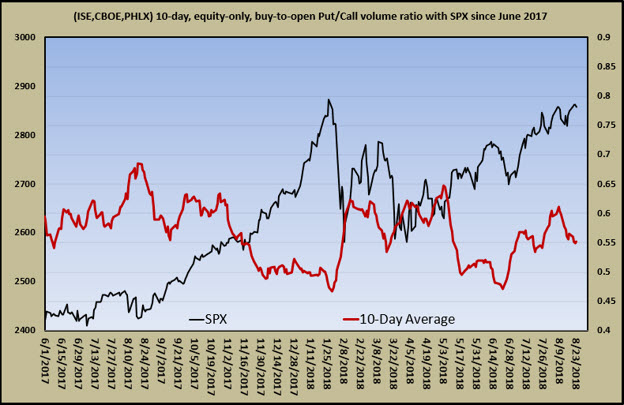
Earlier in this commentary, I wrote that the short-term pessimism observed a few weeks ago is being unwound slowly, implying there is still a bit of trepidation among some traders that is a source of future buying power. This slow unwind is displayed in the chart below, which tracks equity option buyers. Note that the ratio of puts bought to open (a downside bet or long hedge) relative to calls bought to open (an upside bet or short hedge) is still well above the 2018 lows that reflect short-term optimism. If this ratio were low, I would be more hesitant to bet on a breakout in the SPX above its January highs, as the potential source of buying power represented by this ratio would be significantly less.
The stars are aligned for a rally into late September, but they are not perfectly aligned. The risk is that large speculators in Cboe Volatility Index (VIX - 11.99) futures are still betting on a decline in equity market volatility, per Commitments of Traders (CoT) data, which is usually coincident with an upside move in stocks. This group has historically been wrong on major moves in volatility, and they will likely be wrong on the next major volatility move. In other words, the next major move in volatility will likely be higher when CoT large speculators least expect an explosive move higher.
Volatility, as measured by the VIX, has edged higher since mid-July, even as equities have rallied. But if these large speculators remain in an extreme short position on VIX futures, there is higher-than-normal risk of an explosive upside move in volatility. That said, an explosive move higher in volatility could take months to surface, which happened last year. These market participants were net short for months, as volatility measures meandered sideways at low levels for a long time. During this period, the large speculators neither lost nor made money. But they were still short VIX futures ahead of the early 2018 stock market correction and volatility explosion, further damaging an already poor historical track record.
Continue reading: