
Don't underestimate the significance of the S&P's 80-week test, either
"The Cboe Volatility Index (VIX - 18.19) action could give us a clue as to whether the next move will be a retest of the low or a continuation rally from the December bottom. The VIX comes into the week situated between half its December closing high at 18.03, but below half its 2018 closing high at 18.66 and double its 2018 closing low at 18.44. In other words, this area between 18.03 and 18.66 is significant relative to important closing highs and lows since January 2018. A daily close below 18.03 could indicate lower volatility ahead, combined with further strength in equities."
-- Monday Morning Outlook, January 14, 2019
"Fed Officials Weigh Earlier-Than-Expected End to Bond Portfolio Runoff"
-- The Wall Street Journal, January 25, 2019
"We have reached a deal to end the shutdown and reopen the federal government."
-- President Donald Trump, January 25, 2019
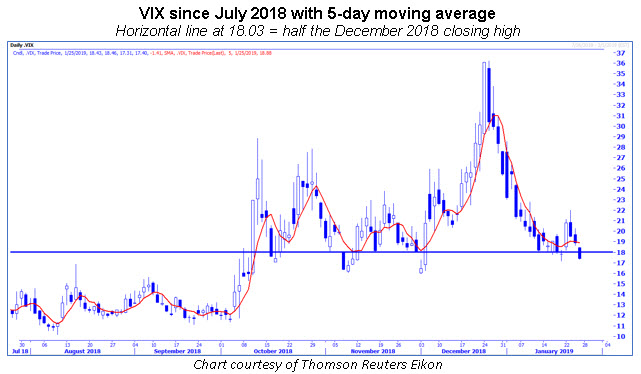
On Friday, Jan. 18, the Cboe Volatility Index (VIX - 17.42) closed barely below 18.03 -- half its December closing high -- but it was short-lived. The market opened lower last week, sending the VIX not only back above key levels discussed two weeks ago, but also above 20.
The good news is that the VIX pop above 20 also proved short-lived, with resistance emerging at its 80-day moving average -- a trendline that previously marked support in early December prior to the VIX more than doubling from those lows as stocks proceeded to tumble throughout the month. And with the help of an article in The Wall Street Journal early Friday morning suggesting that Fed officials may end the bond portfolio runoff sooner than expected, and the government shutdown ending (at least temporarily), stocks rallied strongly on Friday to retest the previous Friday's highs, pushing the VIX back below 18.03.
With the risk of getting whipsawed on daily VIX closes above and below key levels, I noticed that using a 5-day moving average of the VIX might be more trustworthy in terms of signaling where volatility could be headed, especially in this period of rumors versus factual news regarding trade and the Fed.
Coincidentally, I found that the 5-day moving average, prior to the VIX explosion in December, bottomed in the 18.03 area in both November and December. With that said, at risk of getting noised out of daily signals, it could be best to look for the VIX's 5-day moving average to close below this important area to signal additional equity strength and volatility weakness in the weeks ahead.
Additionally, as the S&P 500 Index (SPX - 2,664.76) claws its way out of its December depths, additional key levels that are worth monitoring lie just overhead. The first one that I have been discussing the past couple of weeks is a trendline that connects the peaks set during the first weeks of October and December, which is declining daily and is currently situated at 2,683. Bulls not only hope that this potential trendline resistance does not come into play, but also that a first-week-of-the-month peak does not continue a pattern of SPX highs occurring every two months that we saw in the fourth quarter of 2018.
"Since 1980, breaks of the 80-week moving average have usually preceded tests of the 160-week moving average, which approximates a roughly three-year moving average. With the 160-week moving average currently situated around 2,400, bulls run the risk of at least another 10% pullback if there is a significant breach of the 80-week moving average on a weekly closing basis."
-- Monday Morning Outlook, November 26, 2018
The SPX's 80-week moving average -- at 2,678, and just below the trendline connecting the October and December peaks -- is very much in play again. In late November and early December, I discussed the historical significance of this off-the-radar moving average. The excerpt above highlighted the consequences of a significant break of this trendline, which subsequently occurred in the first week of December and preceded an immediate 10% decline in the SPX to its 160-week moving average, following historical script.
The risk to bulls is a repeat of 2008, when the SPX broke below the 80-week moving average in January, declined into March, and then retested the 80-week moving average in May, but failed to overtake it. After the failure to take back its 80-week moving average in May 2008, the SPX went on to lose about 50% of its value into March 2009 (see the first chart below).
Given the historical significance of the 80-week moving average and the pattern that emerged with this trendline in 2007-2009, it is a good idea to keep this longer-term moving average on your radar, especially since it has marked SPX highs during the past two weeks (see the second chart below). SPX crossovers above this trendline, after trading down to the 160-week moving average like we saw in December, proved to be good long-term buying opportunities, but have had mixed results as far as being short-term buying opportunities.
If a pullback does occur from the area discussed above, a potential area of support is around 2,580-2,590, which marked the lows in February and March of last year. If this area were to break, big put open interest strikes in the February series begin coming into play on SPDR S&P 500 ETF (SPY - 265.78) options, which could send stocks spiraling lower. This is a topic that we will discuss in further detail as we move closer to expiration or if the SPY moves down to these put-heavy strikes in the coming days or weeks.


"Investors, meanwhile, have added some $4 billion to stock funds this month, after withdrawing nearly $100 billion in the fourth quarter. Those inflows have helped the S&P 500 recover more than 13% since bottoming Christmas Eve, leaving the index nearly 8% below September's record high. But some analysts and money managers say they fear the stock market recouped its losses too quickly."
-- The Wall Street Journal, January 21, 2019

Whether it is investor sideline cash coming back into the equity market after $100 billion in stock fund outflows last quarter, or a continued unwinding of the multi-year high in negative sentiment attained by equity option traders in the fourth quarter of 2018, the sentiment landscape suggests there is fuel to push the market higher. That said, a slew of potential technical resistance levels remain overhead, so be cognizant of these levels to appropriately assess risk. Multiple uncertainties continue to linger -- including the shutdown, as the bill signed by Trump on Friday opens the government only through Feb. 15. Other uncertainties weighing on investors also remain unresolved, whether that relates to the Fed or China-U.S. trade talks.
And let's not forget that we are entering the height of earnings season. As more and more companies release earnings, option premiums on equities will decline, making them attractive for managing all of the uncertainties that lie ahead, whether they are used for hedging or speculative purposes.
Continue reading: