
Under-the-radar moving averages can provide unexpected support on pullbacks
The disappearance of journalist Jamal Khashoggi has cast a distinctly unwelcome spotlight onto the Kingdom of Saudi Arabia, as the international community grapples with the political, economic, and moral implications of Khashoggi's fateful Oct. 2 visit to the Saudi consulate in Istanbul. While the U.S. has yet to respond formally as of this writing, senators invoked the Global Magnitsky Act to trigger an investigation -- which raises the prospect that sanctions could be imposed on members of the Saudi royal family, including Crown Prince Mohammed bin Salman, if evidence of wrongdoing is uncovered. By Friday afternoon, Atlanta Fed President Raphael Bostic was citing "the Saudi Arabian situation" as one of the risks to the U.S. economic outlook.
Against this thorny political backdrop, the iShares MSCI Saudi Arabia ETF (KSA) last week was propelled to the forefront. On Monday, Oct. 15, share volume in the regionally focused exchange-traded fund (ETF) exploded to 970,120, reaching its highest daily level since mid-March. And by Wednesday, Oct. 17 -- the same day The New York Times published an article describing Turkish audio recordings of Khashoggi's apparent assassination -- KSA clocked its biggest single-session redemptions of 2018, per etf.com, with outflows totaling nearly $13 million for the day.
That said, the price action in KSA is so far setting up what may turn out to be a near-textbook example of why we at Schaeffer's are such faithful adherents to the school of "under the radar" moving averages -- those that fall outside the margins of the traditional 50-day and 200-day trendlines favored in mainstream technical analysis. By tracking a mix of both shallower and deeper moving averages outside of this "iconic duo," it's often possible to root out buying and selling opportunities that the rest of the trading crowd misses out on.
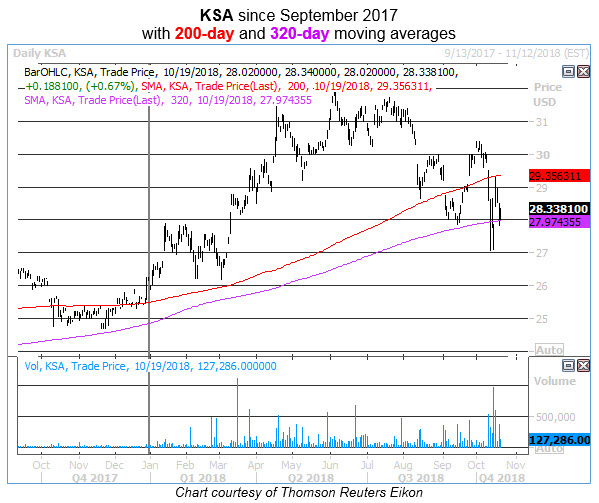
The accompanying chart, for example, shows KSA gapping below its 200-day moving average (in red) in early September, then briefly meeting resistance here later that month prior to a bull gap. KSA fell back below its 200-day on heavy selling on Wednesday, Oct. 10, with a subsequent rebound attempt last Tuesday, Oct. 16, stopped cold squarely at the site of this moving average.
But while the freshly breached 200-day is now threatening to act as resistance for KSA, its lows have generally been contained by the 320-day moving average (in purple). Interestingly, this "safety net" role roughly echoes the 320-day's reassuring presence after the 200-day break that occurred in the fourth quarter of 2017.
Of course, we certainly won't guarantee that this longer-term daily moving average will continue to provide a layer of backup support in the event of sanctions or other major fundamental blows to the Saudi Arabian economy; as always, technical analysis remains but one piece of the broader puzzle. But for now, the price action in KSA is a useful illustration of what we mean when we talk about the power of "behind the scenes" trendlines like the 320-day moving average.
Subscribers to Bernie Schaeffer's Chart of the Week received this commentary on Sunday, October 21.