Investors have been quite bullish on tech and auto sectors
Late last year, we discussed the equity buy-to-open (BTO) put/call ratio hitting extremely low levels, as investors went on a call-buying spree. Assuming the BTO volume is not hedging, a low ratio would indicate a lot of optimism. The data showed an extremely low ratio tended to have bearish implications going forward, making it a good contrarian indicator.
This indicator obviously failed in late 2020, but the BTO put/call ratio remains at a particularly low level. The second chart below shows call buying has fallen since the beginning of the year, but is still historically high, especially when compared to put buying. This week, I will be updating these numbers, and breaking the ratio down by sector to see exactly which sectors investors are the most bullish on.


Comparing Extremes
When I looked at these numbers several months ago, clear underperformance followed extremely low readings. Since then, the market has been so strong that this tendency is no longer applicable. Therefore, I went back to 2010 and found the lowest 15% of readings, and then compared them to the highest 15% of readings, to determine how the S&P 500 Index (SPX) performed over the following month, as well as three months later.
The highest 15% of readings (above 0.64) led to an average S&P 500 return of 7.2% over the next three months, with 88% of the returns positive. The lowest 15% of readings (below 0.445) led to an average three-month return of 3%, with 74% of the readings positive. Plus, the returns following low readings were close to typical market returns. As I mentioned, this was not the case when I ran these numbers late last year.

Breaking Down Bullish and Bearish Sectors
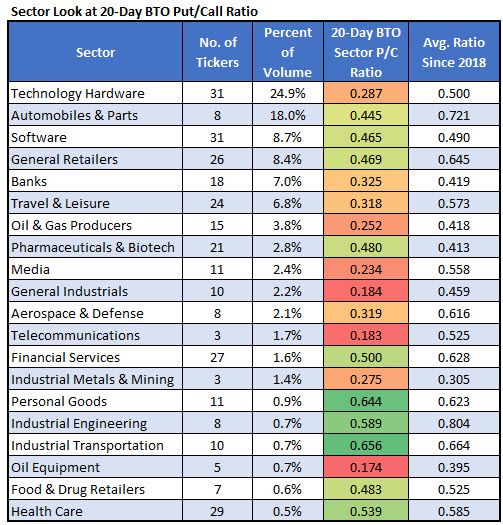
The table below shows the sectors that account for the most BTO volume amongst S&P 500 stocks. Technology hardware and auto stocks make up the most volume, accounting for about 25% and 18%, respectively.
To no one's surprise, call bias is especially prevalent among tech stocks. More specifically, the 20-day BTO put/call ratio for that sector sits at 0.287, which is below its typical level of about 0.5 since 2018. Meanwhile, the ratio on auto stocks is higher than the ratio for the entire index, sitting at 0.445, as opposed to 0.36 for the index. However, the ratio for auto stocks is much lower when compared to its average level of 0.72 since 2018.
When using this ratio to gauge of investor sentiment, pharmaceutical and personal goods stocks are the only two sectors showing more pessimism now as compared to their average ratios since 2018. In other words, those sectors have higher 20-day BTO put/call ratios than they did back then.
