The S&P 500 tends to do well in the days leading up to the long weekend
Traders have a long weekend coming up as markets are closed next Monday for Memorial Day. This week, I am looking at seasonality trends to see how stocks have typically behaved during the holiday week. Additionally, I will list some stocks that have tended to do well and not so well next week.
Memorial Day Week Seasonality
Memorial Day officially became the last Monday of May in 1971. Since then, it has been a bullish week for stocks with the S&P 500 (SPX) averaging a gain of 0.52%, which beats the typical weekly return since then of 0.17%. Recently, however, the upcoming week has been dreadfully bearish. Since 2010, the index has lost an average of 0.60% during the week of Memorial Day. Only five of the 11 returns have been positive. Last year we saw a solid Memorial Day week as the S&P 500 gained just over 3%. While the market has done outstanding since 2010, this coming week of Memorial Day has been an exception.

Breaking it Down by Day
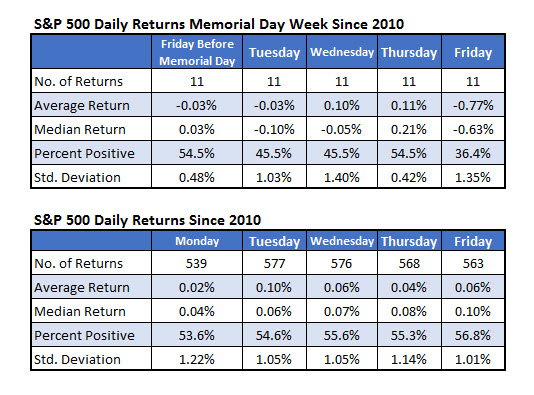
In the table below, I show how the S&P 500 has performed each day from the Friday before Memorial Day to the end of the holiday week. Traders like to add to their positions before the long weekend as the Friday before averages a gain two times the normal Friday return. Despite Tuesday of Memorial Day week being positive just 44% of the time, it averaged a solid gain of 0.19%. Thursday also tends to be a good day for stocks.

Below is similar data, but only since 2010. The week has typically gotten of to a slow start with Tuesday averaging a loss and positive less than half the time. The real driver of the poor returns, however, has been Friday. Traders have tended to sell the last day of the holiday week as Friday has averaged a loss of 0.77% with just 36% of the returns positive.

On the bright side, the S&P 500 is up significantly on the year which has been a good omen for stocks for the rest of the year. When the index was positive through Memorial Day, it averaged a 5.82% gain over the rest of the year with 73.5% of the returns positive. When it has been down heading into the long weekend, it has averaged a slight loss for the rest of the year with just 44% of the returns positive.

Individual Stocks
As promised, below are the S&P 500 stocks that have done the best and worst since 2010 during Memorial Day week. For whatever reason, technology hardware companies and healthcare/pharmaceutical companies make up a decent portion of the bullish stocks.
Oil stocks and banking stocks are the two sectors that show up the most on the bearish list.

