“…according to data from Bank of America Global Research published this week, individuals remain a durable source of buying in this market. And last week, retail was the only bid still out there…cumulative equity flows last week totaled a net $5.2 billion worth of outflows, the largest one-week move out of stocks since November and the fifth largest on record. In the past, these kinds of exoduses from the market have portended shaky periods for investors…”
-Yahoo Finance, April 21, 2021
The implication of this article is that retail investors are the main drivers of the market in 2021, even as hedge funds and institutions have been net sellers. No doubt, we saw in the first quarter how a few stocks were pushed to dizzying heights, as Reddit and the collusion of individual investors made the headlines.
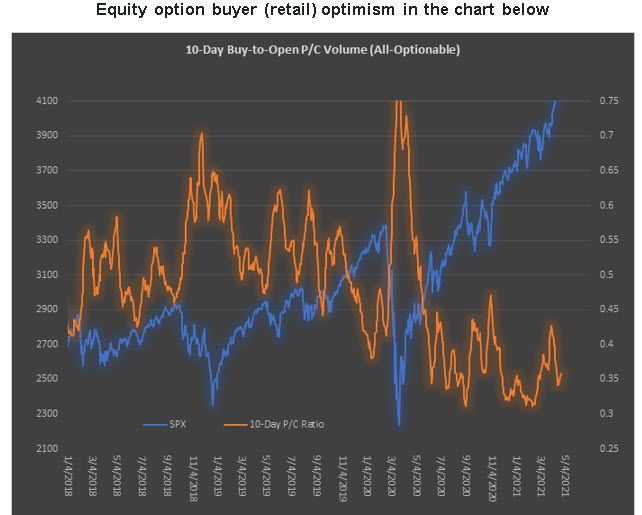
Moreover, we have seen evidence of this in equity option activity, as the ratio of buy (to open) put volume (downside bets or hedges to long positions) relative to buy (to open) call volume (upside bets or hedges to a short position) reaches multi-year lows.

My takeaway on retail flow driving stocks higher has been that if most of these market participants continue to make money, they will likely remain a supportive factor for the equity market.
At the same time, such players, of which some are brand new to this game, tend to be weaker hands, which leaves me to ponder the question, “Will these weaker hands ultimately leave the casino with their new-found riches in hand, or stay in too long?” Staying too long and making the big bet at the wrong time is a risk that institutions and hedge funds are likely seeing, as such groups have been net sellers during the past few weeks. The good news is these participants represent future buying power after moving to the sidelines.
The phrase that comes to my mind from The Art of Contrary Thinking, written by Humphrey Neill, is that “the public is right during the trends, and wrong at both ends.”
Unfortunately, as catchy as this phrase is, there is nothing with respect to the timing of the public being wrong. Therefore, the applicability that I see is that during instances where you see sentiment-based risk heightened, consider hedging or ensure that you have a plan for taking such action when the charts suggest doing so. If the charts continue to look strong, as they do now, it is best to stay the bullish course, with a plan in place to hedge when technical-based risks increase due to higher levels of support breaking down.
Such logic brings me to the next topic …
“… potential support levels as we enter this week’s trading include 4,131 today, which is site of the level that corresponds to 10% above the 2020 close and the top of the channel. On Friday, the top of this channel resides at the SPX 4,150 half-century mark. If you are long on this index or an equivalent, do not disturb positions unless the SPX falls back into its channel by week’s end. And if you want to give more room for a decline before acting, a move below 4,050 might be worth considering.”
-Monday Morning Outlook, April 19, 2021
Continue to be in touch with longer-term historical chart patterns that I discussed in detail last week. If such longer-term historical patterns repeat, a break of important support levels that I have been keying on in recent weeks will clue you in early.
The S&P 500 Index (SPX—4,180.17) bent last week – Thursday’s decline driven by headlines related to President Biden’s plan to nearly double the capital gains tax rate (which I will discuss below) – but it was far from breaking.
Per the chart below, support for the SPX came in at 4,131, which is a round 10% above last year’s close and a level discussed last week. There was one close below the channel connecting higher highs since mid-November, but the SPX quickly moved back above this level. Moreover, the level at which the move above this channel occurred – specifically 4,105 – was never tested on the pullback. This is another level that you can attach importance too.
Additionally, potential support resides at 4,050 – or roughly six times the 2009 closing low- and the round 4,000-millennium point. For what it is worth, the SPX’s 50-day moving average, popular with many technicians and retail investors that use technical analysis, is quickly closing in on that 4,000-round level. Note that this moving average contained two of the past three pullbacks in the in index.

Anecdotally, I happened to have the volume up on Wednesday of last week as Bloomberg television played in the background. I began noticing that the word correction was being tossed around in the afternoon program.
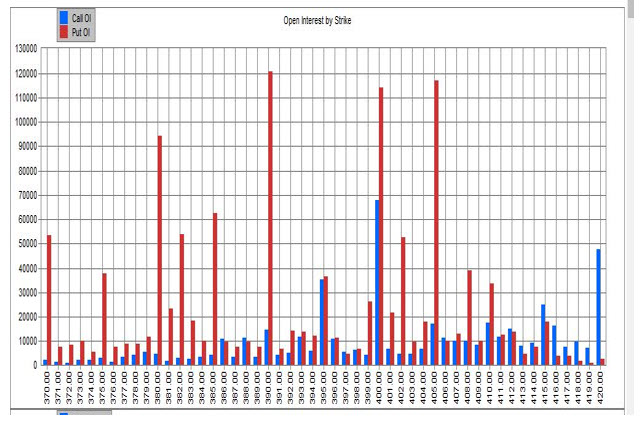
In fact, a Susquehanna analyst noted a 45,000-volume SPDR S&P 500 ETF Trust (SPY—416.74) May 402 strike/382 strike put spread that was put on as a hedge the previous day. The contrarian reaction is that if everyone is bracing for a correction, a correction is not likely.
That said, we have seen rare instances in which the big put open interest build at strikes far below the SPY can sometimes act as magnets, as the correction eventually becomes a self-fulfilling prophecy as sellers of the puts are forced into selling S&P futures when the put strikes are approached, typically after an unexpected catalyst ignites the initial decline.
As it stands now, looking at the standard May expiration series, the SPY would have to move below the 405 strike for the option mechanics discussed above to accelerate a decline. The 405 strike coincides with SPX 4,050, which I discussed above as a potential level of support.

“Markets dropping following second report that President Biden will increase capital gains on wealthy Americans to 39.6% from 20%”
-Briefing.com, April 22, 2021
“The capital gains tax rate is a variable in a model tracked by Keith Parker, who’s the head of U.S. equity strategy at UBS. Historically, when the tax rate changes, so does the multiple on the S&P 500, all else equal. The new proposal could mean a 7% hit to the PE multiple. That’s because a higher rate could dull sentiment toward stocks, with investors less willing to pay up for earnings. Momentum stocks could feel the brunt of the impact, just as they did in 1986, when the tax rate on long-term capital gains rose to 28% from 20%. ‘So one other point to consider is, do stocks with large embedded capital gains start to price this in even more?,’ Parker said. ‘And we have seen some evidence of that playing out in the past.’”
-Bloomberg, April 22, 2021
“The White House plans to propose almost doubling the capital gains tax rate for those earning $1 million or more, to 39.6%, according to people familiar with the proposal. That wouldn’t affect many. Only about 0.32% of American taxpayers reported adjusted gross income of more than $1 million and capital gains or losses on their returns, according to Internal Revenue Service tax return data from 2018.”
-Bloomberg, April 22, 2021
A few thoughts come to mind:
- If retail is indeed the driving force at present, and if indeed we are talking about 0.32% of American taxpayers vulnerable to the tax increase, one might conclude that those driving the market higher are not vulnerable to such a capital gains increase. Therefore, while stocks fell on the headline news, the fact is that it likely did not impact the investing process of more than 99% of market participants driving stocks higher at present.
- The capital gains tax proposal, which is likely to become an official proposal later this week, is not yet law. No one can definitively say that this will come to pass and in what form.
- IF the proposal is enacted in its current form and IF 1986 provides an invaluable road map of what we can expect with respect to momentum names selling off, what stocks are most vulnerable?
Momentum can be defined numerous ways, but one way could be to consider names that the wealthy had early access to via initial public offerings (IPO) in recent years that have produced exorbitant returns. Such a list includes, but is not limited to, those in the table below. This table could be used for future reference if and in what form the capital gains tax proposal comes to fruition.

Todd Salamone is Schaeffer's Senior V.P. of Research
Continue reading: