
Last week's price action may prove to be pivotal for the stock market
"...it appears that the SPY and SPX are shaping up for another flat-to-slightly negative return through mid-July, relative to their respective June 12 closes... If SPX 2,740 and SPY $274 are not taken out relatively quickly, you will likely hear from technicians about the potential formation of a bearish head-and-shoulders pattern, with the left shoulder at the site of the May high, the head at the mid-June peak, and the right shoulder at last week's high... If the bulls push the SPX above 2,740 and SPY above $274, the next major resistance level in the short term is the June peak that was coincident with the most recent rate hike."
-- Monday Morning Outlook, July 2, 2018
The holiday-shortened week that kicked off the second half of 2018 was a win for the bulls, as the S&P 500 Index (SPX - 2,759.82) and SPDR S&P 500 ETF Trust (SPY - 275.42) rallied above 2,740 and $274, respectively -- reducing the odds of a bearish head-and-shoulders pattern developing, as I cautioned about last week. In fact, it appears now that the expected flat-to-slightly negative price action in the month following a rate hike is on course to happen yet again, which has been typical in the aftermath of Fed rate increases in the current tightening cycle.
The rally was topped off on Friday by a well-received employment number, as tariffs on $34 billion of Chinese goods officially went into effect on the same day. The potential ill effects of a trade war have been a predominant theme in the media, so it was interesting that Friday's rally occurred as the U.S. and China took concrete steps toward this end.
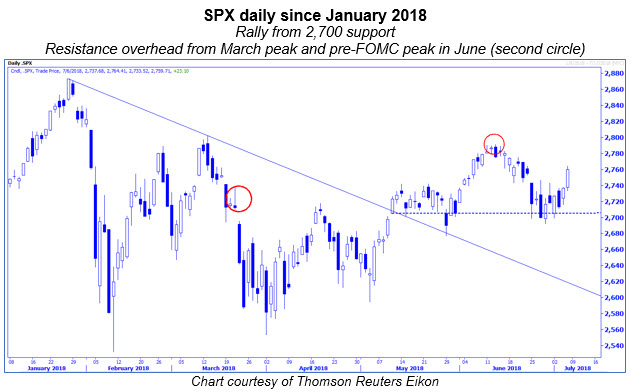
Last week, I mentioned that a "win" for bulls is a scenario in which stocks bounce around between support and resistance as the pre-Fed optimism continues to be unwound. From a support perspective, SPX 2,700 and SPY $270 held impressively on the pullback that followed June's Federal Open Market Committee (FOMC) meeting.
Now, SPX 2,786 and SPY $278.92, which represent the respective closes prior to the June 13 rate hike, reside immediately above Friday's closing levels. The June pre-Fed high was just below the mid-March peak, so this area overhead could be a short-term barrier if follow-through buying from last week continues up to this level.
"...the 10-day, equity-only, buy-to-open put/call volume ratio is now headed higher, implying pre-Fed optimism is now turning into pessimism. The risk to bulls is that this change in sentiment could be in its early innings. A potential win for bulls would be a scenario in which equities chop around between support and resistance levels as pessimism builds. But a negative scenario would be equities experiencing another correction like they did in February, when this ratio turned higher from extremely low levels."
-- Monday Morning Outlook, July 2, 2018
With stocks selling off after the Fed raised rates in June, short-term market participants have soured somewhat on the market. One measure of their mood is the equity-only, buy-to-open put/call volume ratio, where bearish bets (via put buying) have grown relative to bullish bets (via call buying) in recent weeks. We smooth the daily volume ratio with a 10-day moving average, and this trendline has turned higher, to its highest reading in two months. If you look back since September, this ratio is approaching the middle of its range, implying sentiment is near the midpoint of pessimistic and optimistic extremes.
This current reversal from an optimistic sentiment extreme might also be construed as a win for the bulls, because it has done very little damage to the equity market so far. Earlier this year, as I mentioned last week, the ratio turned higher from a similarly optimistic extreme, and equities corrected. That said, if the shift from optimism to pessimism continues in the days ahead, it will continue to be a headwind for equities. But it is also safe to say that from a sentiment perspective, the risk to bulls has decreased relative to three weeks ago, when there was a lot more short-term optimism to wash out.

As we look ahead to next week, investors will have a lot to digest on the economic and earnings front. For example, reports on inflation at the producer and consumer level are due out on Wednesday and Thursday. Moreover, the end of the week marks the start of earnings season, led by major financial institutions such as Citigroup (C), JPMorgan Chase (JPM), PNC (PNC), and Wells Fargo (WFC).
Just as macro and fundamental participants stay in close touch with economic data and earnings reports and technicians watch the charts, we will be in close tune with the options market, as we wind down to that important two-week window before standard July expiration.
With the SPY's advance last week, it has moved further above major put strikes that could act as magnets, thus decreasing delta-hedge selling risk relative to last week at this time. The biggest risk from an options perspective is a reversal of last week's upside action that results in a break of the put-heavy 270 strike. Potential selling would be intense due to the number of put contracts at this strike, as sellers of the puts would be forced to sell a growing number of S&P futures in the process known as delta hedging. The intensity of the selling would likely put other heavy put strikes below 270 in play.
The open interest at the 280-strike call stands out like a redwood in a forest and is also a potential magnet -- that is, if the SPY moves through resistance discussed earlier in the commentary. Sellers of the 280-strike calls would be forced to buy more and more S&P futures as a hedge if that strike comes into play sometime between now and standard options expiration on July 20. If the SPY cannot rally above resistance at $278, long positions associated with the 280-strike calls will be steadily unwound, creating a headwind.

Last week's price action -- which coincided with the start of 2018's second half -- may prove to be pivotal, as the technical backdrop improved even as optimism continued to fade. Less optimism translates into fewer potential sellers and more potential buyers. There are still resistance levels immediately above to pay close attention to, but the good news is there is more buying power now relative to three weeks ago when stocks were getting set to battle resistance and failed.
Continue reading: