A pullback to the 50-day moving average has been bullish for stocks this year
Technical analysis is one of the key tenants of our three-tiered approach to
contrarian trading, known as Expectational Analysis®. Schaeffer's Senior Quantitative Analyst Rocky White ran the numbers on several popular technical indicators to see which has been the best buy signal for stocks so far in 2017. Below is his quick recap of what indicators he looked at for the
S&P 500 Index (SPX), and why
Netflix, Inc. (NASDAQ:NFLX) is one FAANG stock bulls should be targeting.
- RSI: The RSI is an oscillator that ranges from zero to 100. A low-number reading suggests a stock is oversold and ready to bounce. Because stocks can stay oversold for an extended period of time, the buy signal is defined as when the RSI goes from below 30 to above 30. In other words, it was oversold and is now heading upward.
- MACD: The MACD is calculated using the difference in two different moving averages for a stock. A moving average of that difference is then used, and called the signal line. A common buy signal is generated when the MACD crosses above that signal line.
- Golden Cross: A golden cross is when a shorter-term moving average crosses above a longer-term moving average. In the analysis below, I used a 50-day and 200-day moving average.
- Moving Average Crossover: This is simply looking at the stock price crossing above a certain moving average. I compared returns after the price crossed above 50- and 200-day moving averages.
- Bollinger Bands: These use a moving average, and then bands are placed two standard deviations above and below it. When the stock price touches the lower band, it is often considered oversold, and a bounce in the stock price is expected.
- Moving Average Pullbacks: For a stock on the rise, some traders might wait for a pullback to enter the position. One popular way to define a pullback (which is then a buy signal) is when the stock falls to within a range of a rising moving average. I considered pullbacks to the 50-day and 200-day moving averages, when the stock has been above the trendline for the last couple months, is trading within 2% of it, and the moving average is sloping up.
The best "buy" signal for SPX stocks so far in 2017 has been the pullback to the 50-day moving average, with stocks averaging a one-month return of 1.8%. For the sake of comparison, the worst returns came after a stock crossed over its 50-day moving average. This is a prime example of why it's integral to keep a close eye on your trading tools, as this was one of the most
bullish indicators in 2016.

NFLX Options are Cheap at the Moment
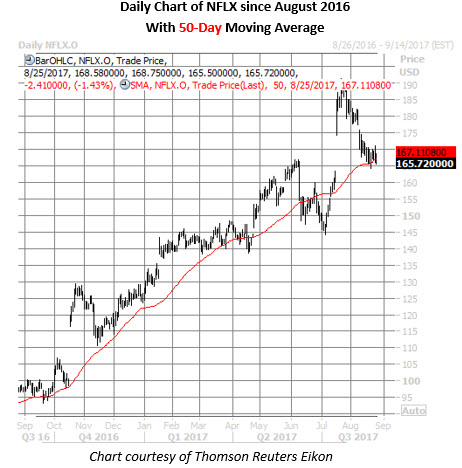
If past is precedent, streaming giant Netflix could be screaming "buy." Since topping out at a record high of $191.50 on July 21, NFLX stock has pulled back along with the broader
tech sector, and is now hovering just north of its 50-day moving average -- which is near its June highs -- to trade at $165.72. Nevertheless, the shares are still boasting a 34.3% year-to-date lead.

Now appears to be an attractive time to trade Netflix stock options, too. The equity's Schaeffer's Volatility Index (SVI) of 28% ranks in the 12th annual percentile, indicating low volatility expectations are being priced into short-term options -- a potential boon to premium buyers.
Here's a list of 25 SPX stocks that pulled back to their 50-day moving average in the last two weeks. While NFLX leads in terms of biggest 52-week return, several bank stocks are also on the list.
