
The SPX logged its worst single session since early April on Friday
Subscribers to Chart of the Week received this commentary on Sunday, October 12.
Over the past week gold prices have turned in a record-breaking performance, triggered by government shutdown drama, interest rate cut expectations, and late-week tariff tensions with China. But bullion has been rallying well before these factors formed a perfect storm this week.
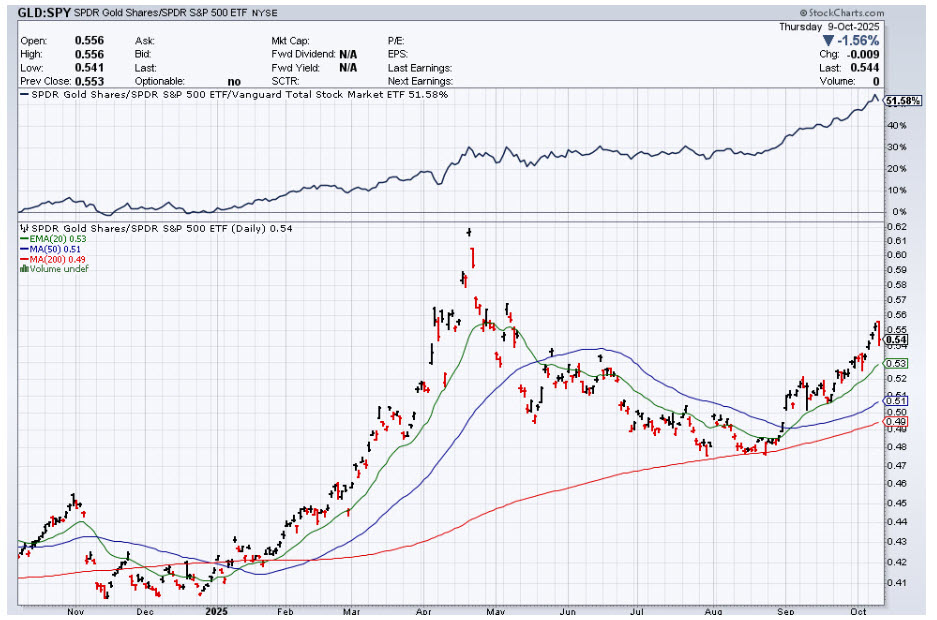
As gold futures charged above the $4,000 price per ounce, the S&P 500 Index (SPX) pushed higher as well, hitting a record high of $6,774.58 on Thursday. Exchange traded fund (ETF) SPDR Gold Trust (GLD) topped $373.57 a day earlier, pushing the SPX/GLD ratio to 0.54 by week’s end. A confluent of moving averages now sit below the ratio, with the most notable support at the 200-day trendline (red).
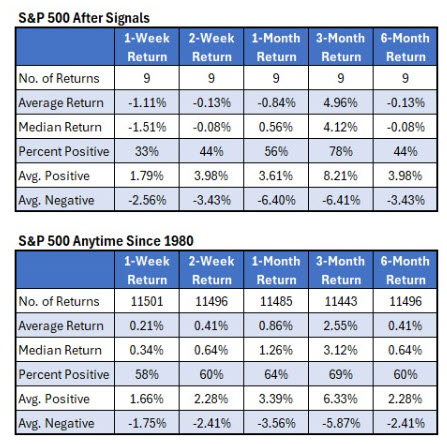
Over the past two months, gold has rallied more than 18% and the SPX around 5%. The tables below show how the S&P 500 and gold have performed after two-month periods where gold was up at least 18% and the SPX was up 5%. After this signal anytime, the S&P 500 saw an average six-month return of -0.1% with less than half returns positive. Since 1980 overall, some of these losses are pared back, showing an average 0.4% return with 60% of those positive.
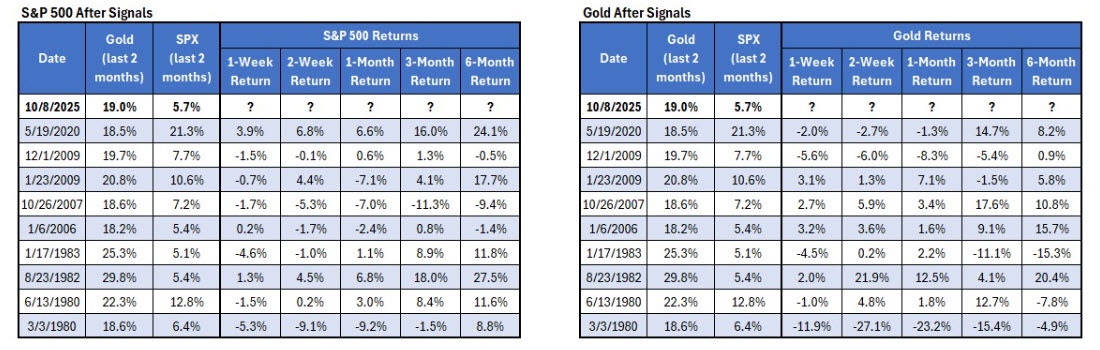
The tables below show a more detailed breakdown of how the SPX and gold did after each of the nine signals since 1980. The last signal was in May 2020, which showed an outperformance from stocks across all timeframes. However, gold did not do well in the short term, and in general both the SPX and bullion underperform in the short term, when looking back at all signals since 1980. Further complicating the picture is gold’s 14-day Relative Strength Index (RSI), which traded as high as 82.50 earlier this week, per FactSet. The last time bullion was this overbought, a three-week drawdown ensued in April 2024, per MarketWatch.
Between gold and stocks at record highs, something had to eventually give, and on Friday, it was the SPX, logging its worst single session since early April as President Donald Trump ramped up the tariff rhetoric. As investors potentially turn in their profits in the coming days, it will be fascinating to see what geopolitical turmoil does to an already overextended safe-haven asset. Does precedent and relative strength win out, or will conventional wisdom keep the momentum going? With so many conflicting signals and an increasingly murky macro landscape, it’s always helpful to fall back on quantitative data to clear the path forward.